us_color <- "#ffb86c"
cn_color <- "#bd93f9"
ggplot(transit_us_cn, aes(length, real_cost, label = label)) +
geom_hline(yintercept = 0, size = 0.3, color = "#6272a4") +
geom_point(aes(color = country), size = 2, alpha = 0.8) +
geom_text_repel(family = "Inter-Light", size = 3.5, color = "#f8f8f2", segment.color = "#f8f8f2", segment.alpha = 0.7) +
scale_y_continuous(labels = function(x) ifelse(x > 0, paste0("$", x, "B"), paste0("$", x)), breaks = seq(0, 16, by = 1)) +
scale_x_continuous(breaks = seq(0, 80, by = 10)) +
scale_color_manual(values = c(cn_color, us_color)) +
guides(color = FALSE) +
labs(
title = "The Cost of Transit in the 21<sup>st</sup> Century",
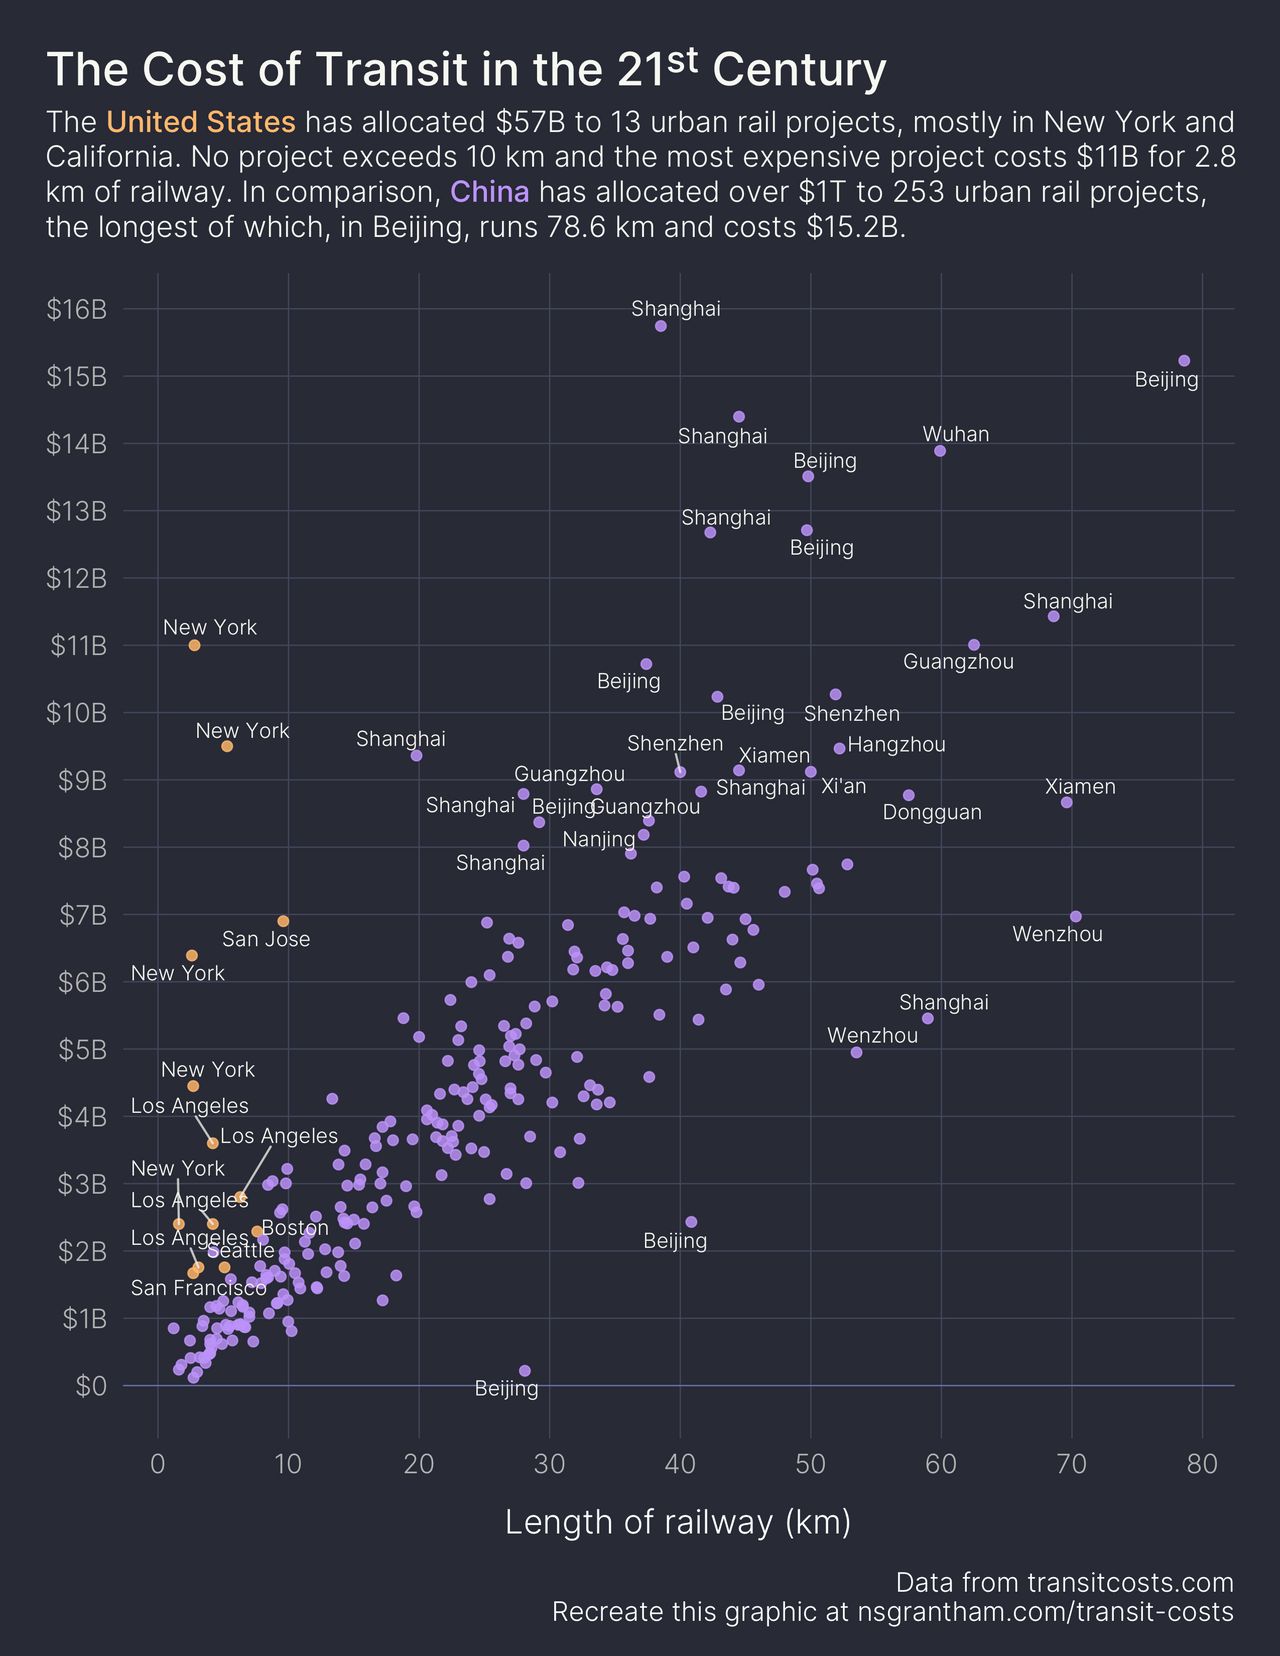
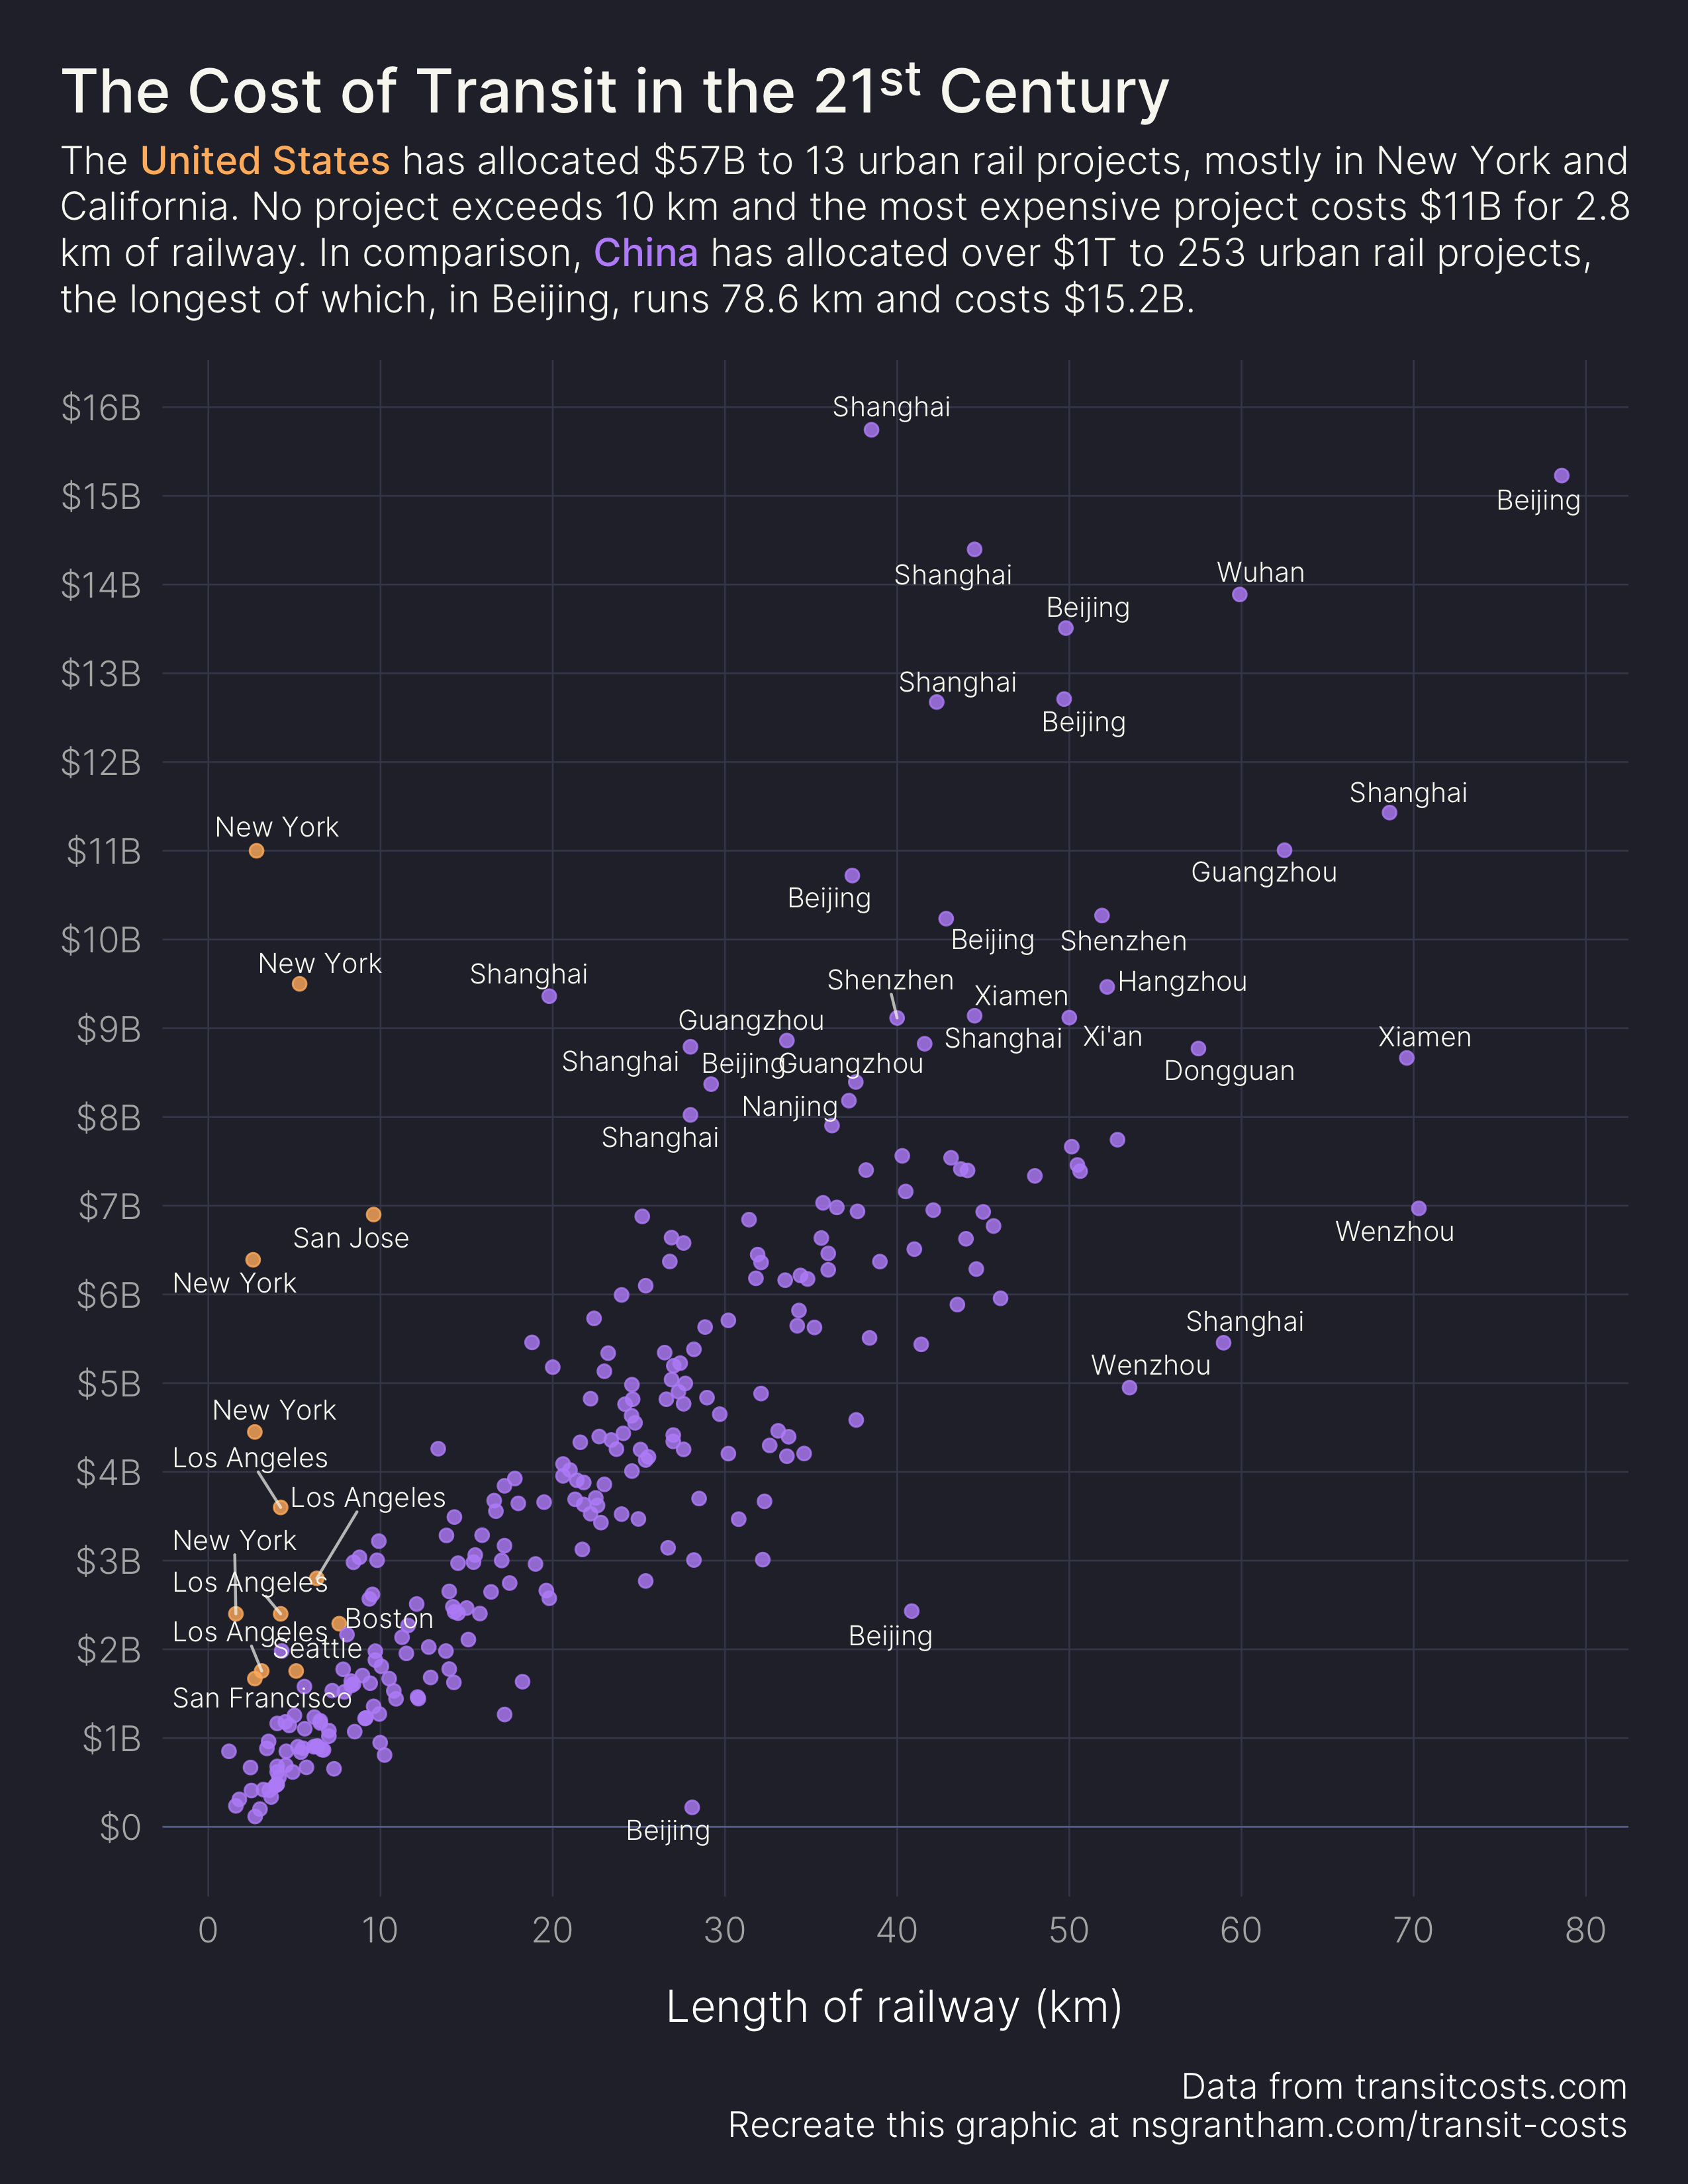
subtitle = glue::glue("The <span style='color:{us_color};font-family:Inter-Medium;'>United States</span> has allocated $57B to 13 urban rail projects, mostly in New York and<br />California. No project exceeds 10 km and the most expensive project costs $11B for 2.8<br />km of railway. In comparison, <span style='color:{cn_color};font-family:Inter-Medium;'>China</span> has allocated over $1T to 253 urban rail projects,<br />the longest of which, in Beijing, runs 78.6 km and costs $15.2B."),
y = NULL, x = "Length of railway (km)",
caption = "Data from transitcosts.com\nRecreate this graphic at nsgrantham.com/transit-costs"
) +
dark_theme_minimal(base_family = "Inter-Light", base_size = 16) +
theme(
plot.title = element_markdown(family = "Inter-Medium", color = "#f8f8f2", size = 22, margin = margin(0, 0, 0.5, 0, unit = "line")),
plot.title.position = "plot",
plot.subtitle = element_markdown(color = "#f8f8f2", size = 14, lineheight = 1.2, margin = margin(0, 0, 1, 0, unit = "line")),
plot.margin = margin(1.5, 1.5, 1, 1.5, unit = "line"),
plot.background = element_rect(fill = "#282a36", color = "#282a36"),
axis.title.x = element_text(margin = margin(1, 0, 0.5, 0, unit = "line")),
panel.grid.major.y = element_line(color = "#44475a", size = 0.3),
panel.grid.major.x = element_line(color = "#44475a", size = 0.3),
panel.grid.minor.y = element_blank(),
panel.grid.minor.x = element_blank()
)
ggsave("transit-costs.png", width = 8.5, height = 11)