Do episodes that Mindy Kaling and B.J. Novak feature more lines of dialogue from their characters, Kelly Kapoor and Ryan Howard, than episodes by other writers?
We analyze a dataset of lines of dialogue in The Office from the schrute R package to find out.
library(tidyverse)
library(schrute)
library(ggtext)

data(theoffice)

theoffice
# A tibble: 55,130 x 9
   index season episode episode_name director  writer     character text             text_w_direction
   <int> <chr>  <chr>   <chr>        <chr>     <chr>      <chr>     <chr>            <chr>
 1     1 01     01      Pilot        Ken Kwap… Ricky Ger… Michael   All right Jim. … All right Jim. Your quart…
 2     2 01     01      Pilot        Ken Kwap… Ricky Ger… Jim       Oh, I told you.… Oh, I told you. I couldn'…
 3     3 01     01      Pilot        Ken Kwap… Ricky Ger… Michael   So you've come … So you've come to the mas…
 4     4 01     01      Pilot        Ken Kwap… Ricky Ger… Jim       Actually, you c… Actually, you called me i…
 5     5 01     01      Pilot        Ken Kwap… Ricky Ger… Michael   All right. Well… All right. Well, let me s…
 6     6 01     01      Pilot        Ken Kwap… Ricky Ger… Michael   Yes, I'd like t… [on the phone] Yes, I'd l…
 7     7 01     01      Pilot        Ken Kwap… Ricky Ger… Michael   I've, uh, I've … I've, uh, I've been at Du…
 8     8 01     01      Pilot        Ken Kwap… Ricky Ger… Pam       Well. I don't k… Well. I don't know.
 9     9 01     01      Pilot        Ken Kwap… Ricky Ger… Michael   If you think sh… If you think she's cute n…
10    10 01     01      Pilot        Ken Kwap… Ricky Ger… Pam       What?            What?
# … with 55,120 more rows
Who have written the most episodes of The Office?
episodes_per_writer <- theoffice %>%
  select(season, episode, writer) %>%
  distinct() %>%
  count(writer, sort = TRUE)

episodes_per_writer
# A tibble: 47 x 2
   writer                            n
   <chr>                         <int>
 1 Mindy Kaling                     20
 2 B.J. Novak                       15
 3 Paul Lieberstein                 13
 4 Brent Forrester                   9
 5 Greg Daniels                      9
 6 Justin Spitzer                    9
 7 Jennifer Celotta                  8
 8 Charlie Grandy                    7
 9 Gene Stupnitsky;Lee Eisenberg     7
10 Michael Schur                     7
# … with 37 more rows
Mindy Kaling has written 20 episodes, the most of any other writer, followed by B.J. Novak at 15 episodes. Both Kaling and Novak play characters on the show, Kelly Kapoor and Ryan Howard respectively.
What are all the episodes?
episodes <- theoffice %>%
  select(season, episode, episode_name, writer) %>%
  mutate(
    writer = case_when(
      str_detect(writer, "Mindy Kaling") ~ "Mindy Kaling",
      str_detect(writer, "B.J. Novak") ~ "B.J. Novak",
      TRUE ~ "Other writers"
    )
  ) %>%
  distinct()

episodes
# A tibble: 186 x 4
   season episode episode_name      writer
   <chr>  <chr>   <chr>             <chr>
 1 01     01      Pilot             Other writers
 2 01     02      Diversity Day     B.J. Novak
 3 01     03      Health Care       Other writers
 4 01     04      The Alliance      Other writers
 5 01     05      Basketball        Other writers
 6 01     06      Hot Girl          Mindy Kaling
 7 02     01      The Dundies       Mindy Kaling
 8 02     02      Sexual Harassment B.J. Novak
 9 02     03      Office Olympics   Other writers
10 02     04      The Fire          B.J. Novak
# … with 176 more rows
And let’s count lines of dialogue per Ryan and Kelly in each episode.
dialogue <- theoffice %>%
  select(season, episode, character) %>%
  mutate(character = case_when(
    str_detect(character, "Kelly") ~ "Kelly",
    str_detect(character, "Ryan") ~ "Ryan",
    TRUE ~ "Other characters"
  )) %>%
  group_by(season, episode) %>%
  count(character) %>%
  mutate(prop = n / sum(n)) %>%
  ungroup() %>%
  filter(character != "Other characters")

dialogue
# A tibble: 282 x 5
   season episode character     n    prop
   <chr>  <chr>   <chr>     <int>   <dbl>
 1 01     01      Ryan          8 0.0349
 2 01     02      Kelly         2 0.00985
 3 01     02      Ryan          4 0.0197
 4 01     03      Ryan          1 0.00410
 5 01     04      Ryan          4 0.0165
 6 01     05      Ryan          8 0.0348
 7 01     06      Ryan         12 0.0347
 8 02     01      Kelly         7 0.0273
 9 02     01      Ryan          2 0.00781
10 02     02      Ryan          1 0.00353
# … with 272 more rows
Now let’s create a full dataframe we’ll use for plotting.
kelly_ryan <- writers %>%
  select(season, episode) %>%
  distinct() %>%
  mutate(Kelly = NA, Ryan = NA) %>%
  pivot_longer(c("Kelly", "Ryan"), names_to = "character", values_to = "dummy") %>%
  select(-dummy) %>%
  left_join(episodes, by = c("season", "episode")) %>%
  left_join(dialogue, by = c("season", "episode", "character")) %>%
  replace_na(list("n" = 0, "prop" = 0)) %>%
  mutate(
    season = paste("Season", as.numeric(season)),
    episode = as.numeric(episode),
    episode_name = case_when(
      character == "Ryan" ~ "",
      episode_name == "Lecture Circuit (Part 1)" ~ "Lecture Circuit (Parts 1&2)",
      episode_name == "Lecture Circuit (Part 2)" ~ "",
      episode_name == "Sexual Harassment" ~ "Sexual\nHarassment",
      TRUE ~ episode_name
    )
  )

kelly_ryan
# A tibble: 372 x 7
   season   episode character episode_name    writer            n    prop
   <chr>      <dbl> <chr>     <chr>           <chr>         <dbl>   <dbl>
 1 Season 1       1 Kelly     "Pilot"         Other writers     0 0
 2 Season 1       1 Ryan      ""              Other writers     8 0.0349
 3 Season 1       2 Kelly     "Diversity Day" B.J. Novak        2 0.00985
 4 Season 1       2 Ryan      ""              B.J. Novak        4 0.0197
 5 Season 1       3 Kelly     "Health Care"   Other writers     0 0
 6 Season 1       3 Ryan      ""              Other writers     1 0.00410
 7 Season 1       4 Kelly     "The Alliance"  Other writers     0 0
 8 Season 1       4 Ryan      ""              Other writers     4 0.0165
 9 Season 1       5 Kelly     "Basketball"    Other writers     0 0
10 Season 1       5 Ryan      ""              Other writers     8 0.0348
# … with 362 more rows
Finally, some notes for the plot, and the plot itself.
notes <- tribble(
~season, ~episode, ~text, ~character, ~prop,
"Season 1", 6, "— 20 lines of dialogue for every 100 lines in the episode", "Ryan", 0.2,
"Season 1", 6, "— 10 lines of dialogue for every 100 lines in the episode", "Ryan", 0.1,
"Season 1", 6, "— No lines of dialogue for every 100 lines in the episode", "Ryan", 0.0,
)
mk_color <- "#9D02D7"
bn_color <- "#FA8775"
ggplot() +
geom_rect(data = kelly_ryan, aes(xmin = -Inf, xmax = Inf, ymin = -Inf, ymax = 0.205, color = writer), alpha = 0, size = 0.3) +
geom_col(data = kelly_ryan, aes(x = character, y = prop, fill = character), width = 0.7) +
geom_text(data = filter(df, writer != "Other writers"), aes(x = 1.5, y = 0.235, label = episode_name), family = "Fira Sans Extra Condensed Light", size = 2.5, lineheight = 0.7) +
geom_text(data = notes, aes(x = character, y = prop, label = text), family = "Fira Sans Extra Condensed Light", size = 3, lineheight = 0.9, hjust = -0.05) +
facet_grid(season ~ episode, switch = "both") +
scale_color_manual(values = c(bn_color, mk_color, "#F0F0F0")) +
scale_fill_manual(values = c(mk_color, bn_color)) +
guides(color = FALSE, fill = FALSE) +
labs(
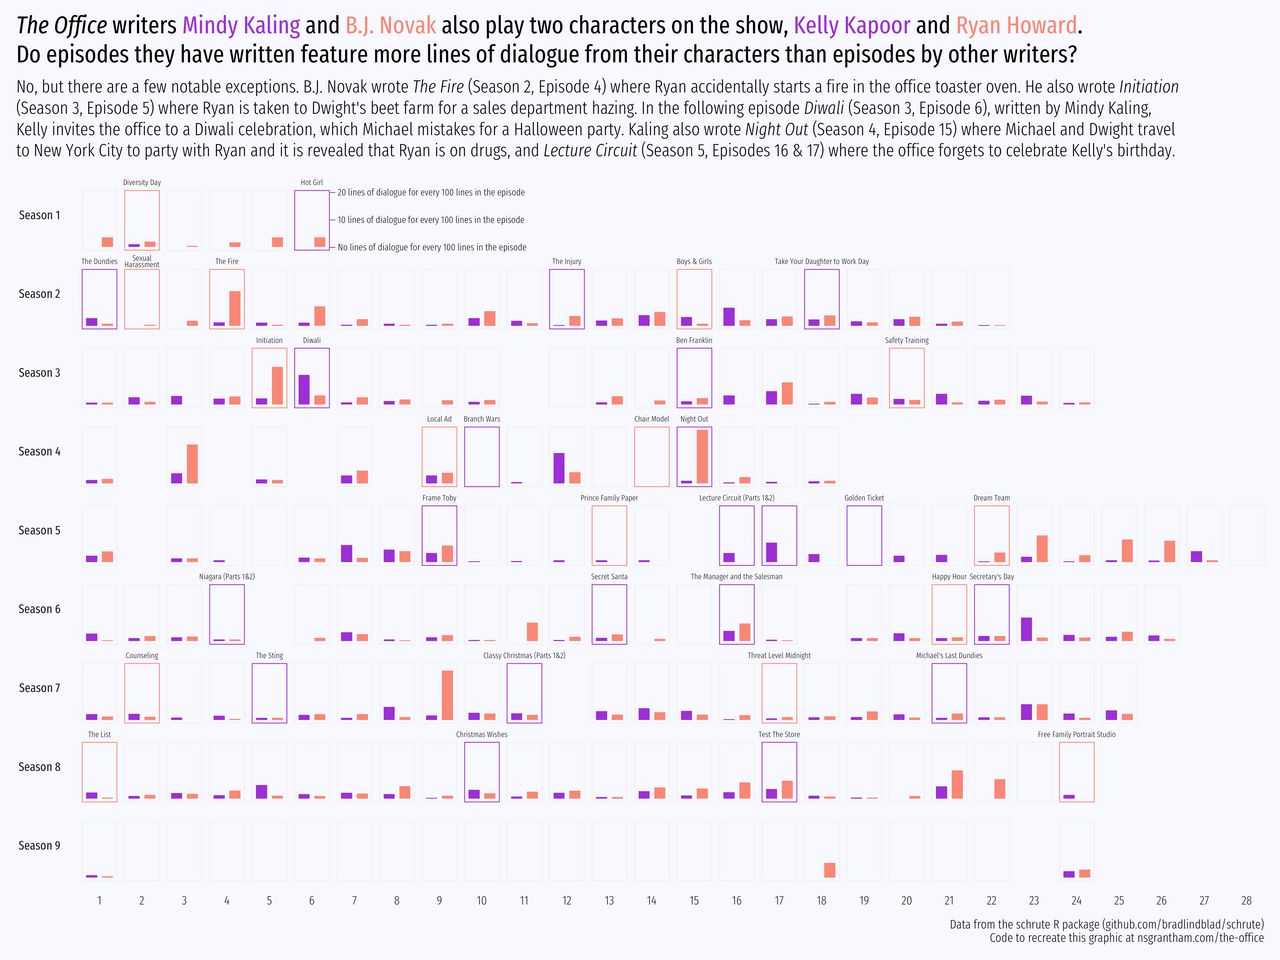
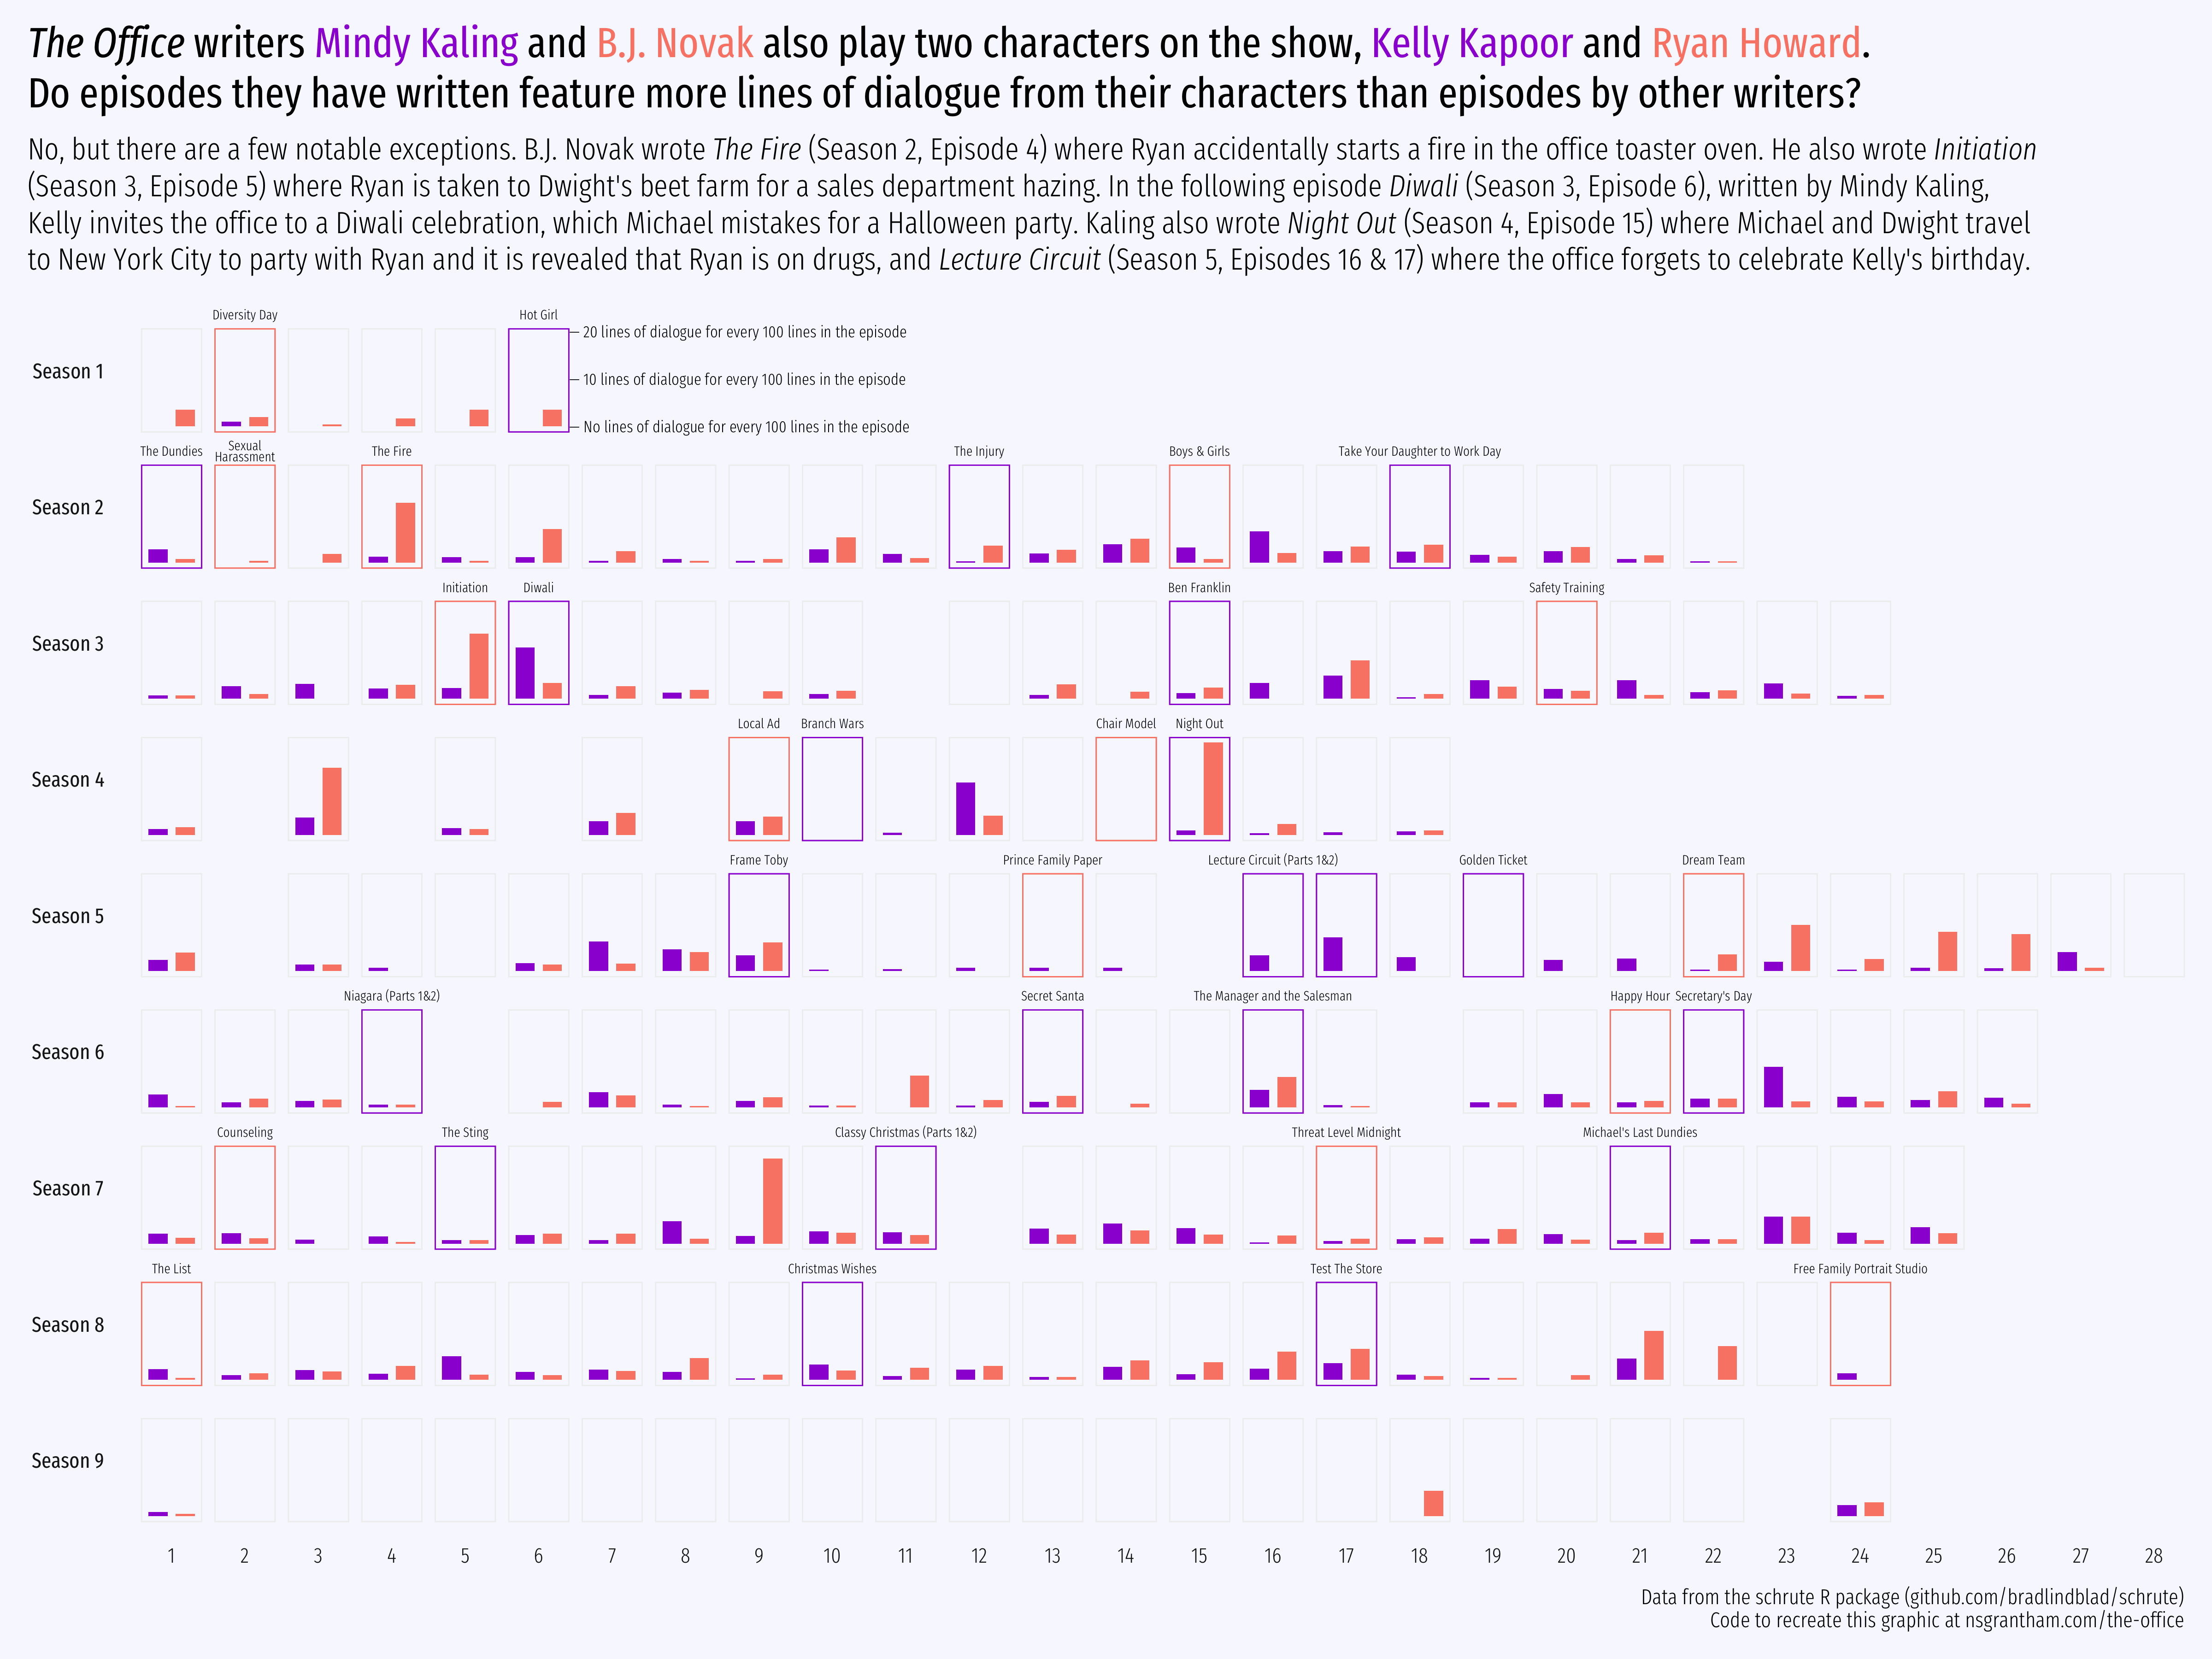
title = glue::glue("<i>The Office</i> writers <span style='color:{mk_color}'>Mindy Kaling</span> and <span style='color:{bn_color}'>B.J. Novak</span> also play two characters on the show, <span style='color:{mk_color}'>Kelly Kapoor</span> and <span style='color:{bn_color}'>Ryan Howard</span>.<br>Do episodes they have written feature more lines of dialogue from their characters than episodes by other writers? "),
subtitle = "No, but there are a few notable exceptions. B.J. Novak wrote <i>The Fire</i> (Season 2, Episode 4) where Ryan accidentally starts a fire in the office toaster oven. He also wrote <i>Initiation</i><br>(Season 3, Episode 5) where Ryan is taken to Dwight's beet farm for a sales department hazing. In the following episode <i>Diwali</i> (Season 3, Episode 6), written by Mindy Kaling,<br>Kelly invites the office to a Diwali celebration, which Michael mistakes for a Halloween party. Kaling also wrote <i>Night Out</i> (Season 4, Episode 15) where Michael and Dwight travel<br>to New York City to party with Ryan and it is revealed that Ryan is on drugs, and <i>Lecture Circuit</i> (Season 5, Episodes 16 & 17) where the office forgets to celebrate Kelly's birthday.",
caption = "Data from the schrute R package (github.com/bradlindblad/schrute)\nCode to recreate this graphic at nsgrantham.com/the-office",
x = NULL, y = NULL
) +
theme_minimal(base_family = "Fira Sans Extra Condensed Light", base_size = 14) +
theme(
plot.title = element_markdown(family = "Fira Sans Extra Condensed", margin = margin(0, 0, 0.8, 0, unit = "line"), size = 22, lineheight = 1.2),
plot.subtitle = element_markdown(size = 16, margin = margin(0, 0, 1.2, 0, unit = "line"), lineheight = 1.2),
plot.background = element_rect(fill = "#F8F8FF", color = "#F8F8FF"),
plot.title.position = "plot",
plot.margin = margin(1, 1, 1, 1, unit = "line"),
panel.grid.major.y = element_blank(),
panel.grid.minor.y = element_blank(),
panel.grid.major.x = element_blank(),
strip.text.y.left = element_text(family = "Fira Sans Extra Condensed", angle = 0, margin = margin(0, 1, 0, 0, unit = "line")),
strip.placement = "bottom",
axis.text.y = element_blank(),
axis.ticks.y = element_blank(),
axis.text.x = element_blank()
) +
coord_cartesian(clip = "off")
ggsave("the-office.png", width = 16, height = 12)
For the most part, Mindy Kaling and B.J. Novak do not write more lines of dialogue for their characters than other writers.