period_labels <- tribble(
~x, ~y, ~label,
1910, 0.90, "Pre-1800s",
1920, 0.65, "1800–1849",
1930, 0.40, "1850–1899",
1945, 0.22, "1900–1924",
1957, 0.12, "1925–1949",
1971, 0.06, "1950–1974",
1990, 0.04, "1975–1999",
2008, 0.02, "2000-2013"
)
percentage_labels <- tribble(
~x, ~y, ~label, ~color,
1896, 0.18, "33%", "#bd93f9",
1896, 0.52, "36%", "#ff79c6",
1896, 0.85, "31%", "#6272a4",
2017, 0.03, " 6%", "#ff5555",
2017, 0.19, "28%", "#ffb86c",
2017, 0.51, "32%", "#f1fa8c",
2017, 0.70, " 8%", "#50fa7b",
2017, 0.77, " 6%", "#8be9fd",
2017, 0.84, " 6%", "#bd93f9",
2017, 0.91, " 9%", "#ff79c6",
2017, 0.98, " 5%", "#6272a4"
)
ggplot(artwork) +
geom_area(aes(acquisitionYear, n, fill = period), position = "fill", alpha = 0.6) +
geom_text(data = period_labels, aes(x, y, label = label), color = "#f8f8f2", family = "Inter-Light") +
geom_text(data = percentage_labels, aes(x, y, label = label, color = color), family = "Inter-Regular", size = 5) +
scale_x_continuous(breaks = c(1825, 1850, 1900, 1925, 1950, 1975, 2000, 2013)) +
scale_fill_manual(values = rev(c("#ff5555", "#ffb86c", "#f1fa8c", "#50fa7b", "#8be9fd", "#bd93f9", "#ff79c6", "#6272a4"))) +
scale_color_identity() +
guides(fill = FALSE) +
labs(
title = "The Ever-Changing Composition of the Tate Artwork Collection*",
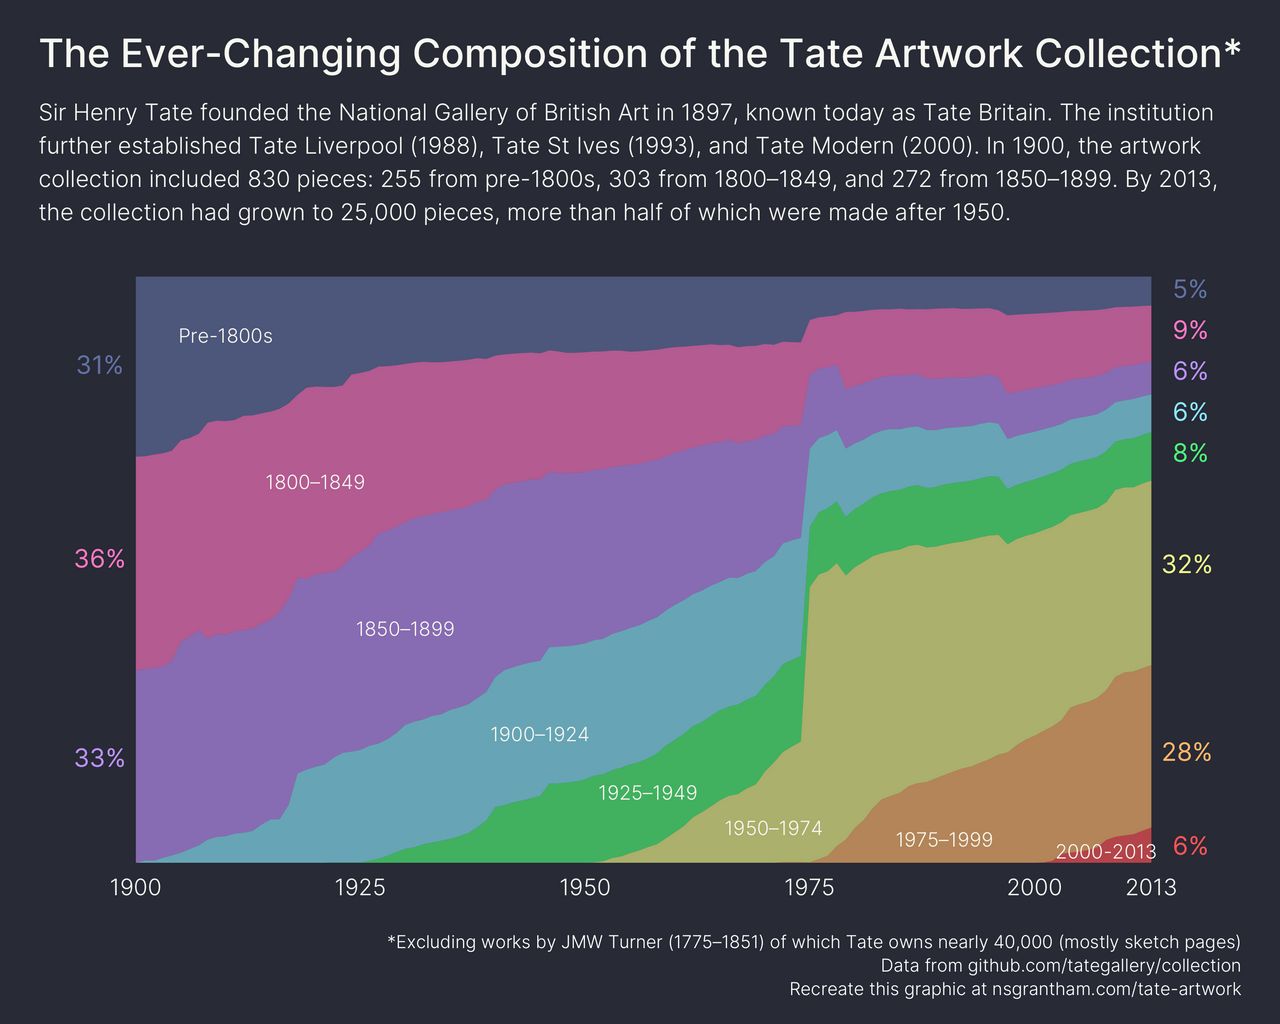
subtitle = "Sir Henry Tate founded the National Gallery of British Art in 1897, known today as Tate Britain. The institution\nfurther established Tate Liverpool (1988), Tate St Ives (1993), and Tate Modern (2000). In 1900, the artwork\ncollection included 830 pieces: 255 from pre-1800s, 303 from 1800–1849, and 272 from 1850–1899. By 2013,\nthe collection had grown to 25,000 pieces, more than half of which were made after 1950.",
caption = "*Excluding works by JMW Turner (1775–1851) of which Tate owns nearly 40,000 (mostly sketch pages)\nData from github.com/tategallery/collection\nRecreate this graphic at nsgrantham.com/tate-artwork",
x = NULL
) +
dark_theme_minimal(base_family = "Inter-Light", base_size = 16) +
theme(
plot.background = element_rect(fill = "#282a36", color = "#282a36"),
plot.title = element_text(family = "Inter-Medium", color = "#f8f8f2", size = 22, margin = margin(0, 0, 0.8, 0, unit = "line")),
plot.title.position = "plot",
plot.subtitle = element_text(color = "#f8f8f2", size = 13, lineheight = 1.2, margin = margin(0, 0, 0.8, 0, unit = "line")),
plot.caption = element_text(size = 10, lineheight = 1.1),
plot.margin = margin(1.5, 1.5, 1, 1.5, unit = "line"),
panel.grid.major.x = element_blank(),
panel.grid.minor.x = element_blank(),
panel.grid.major.y = element_blank(),
panel.grid.minor.y = element_blank(),
axis.title.y = element_blank(),
axis.text.y = element_blank(),
axis.title.x = element_text(),
axis.text.x = element_text(color = "#f8f8f2", margin = margin(-1, 0, 1, 0, unit = "line"))
)
ggsave("tate-artwork.png", width = 10, height = 8)