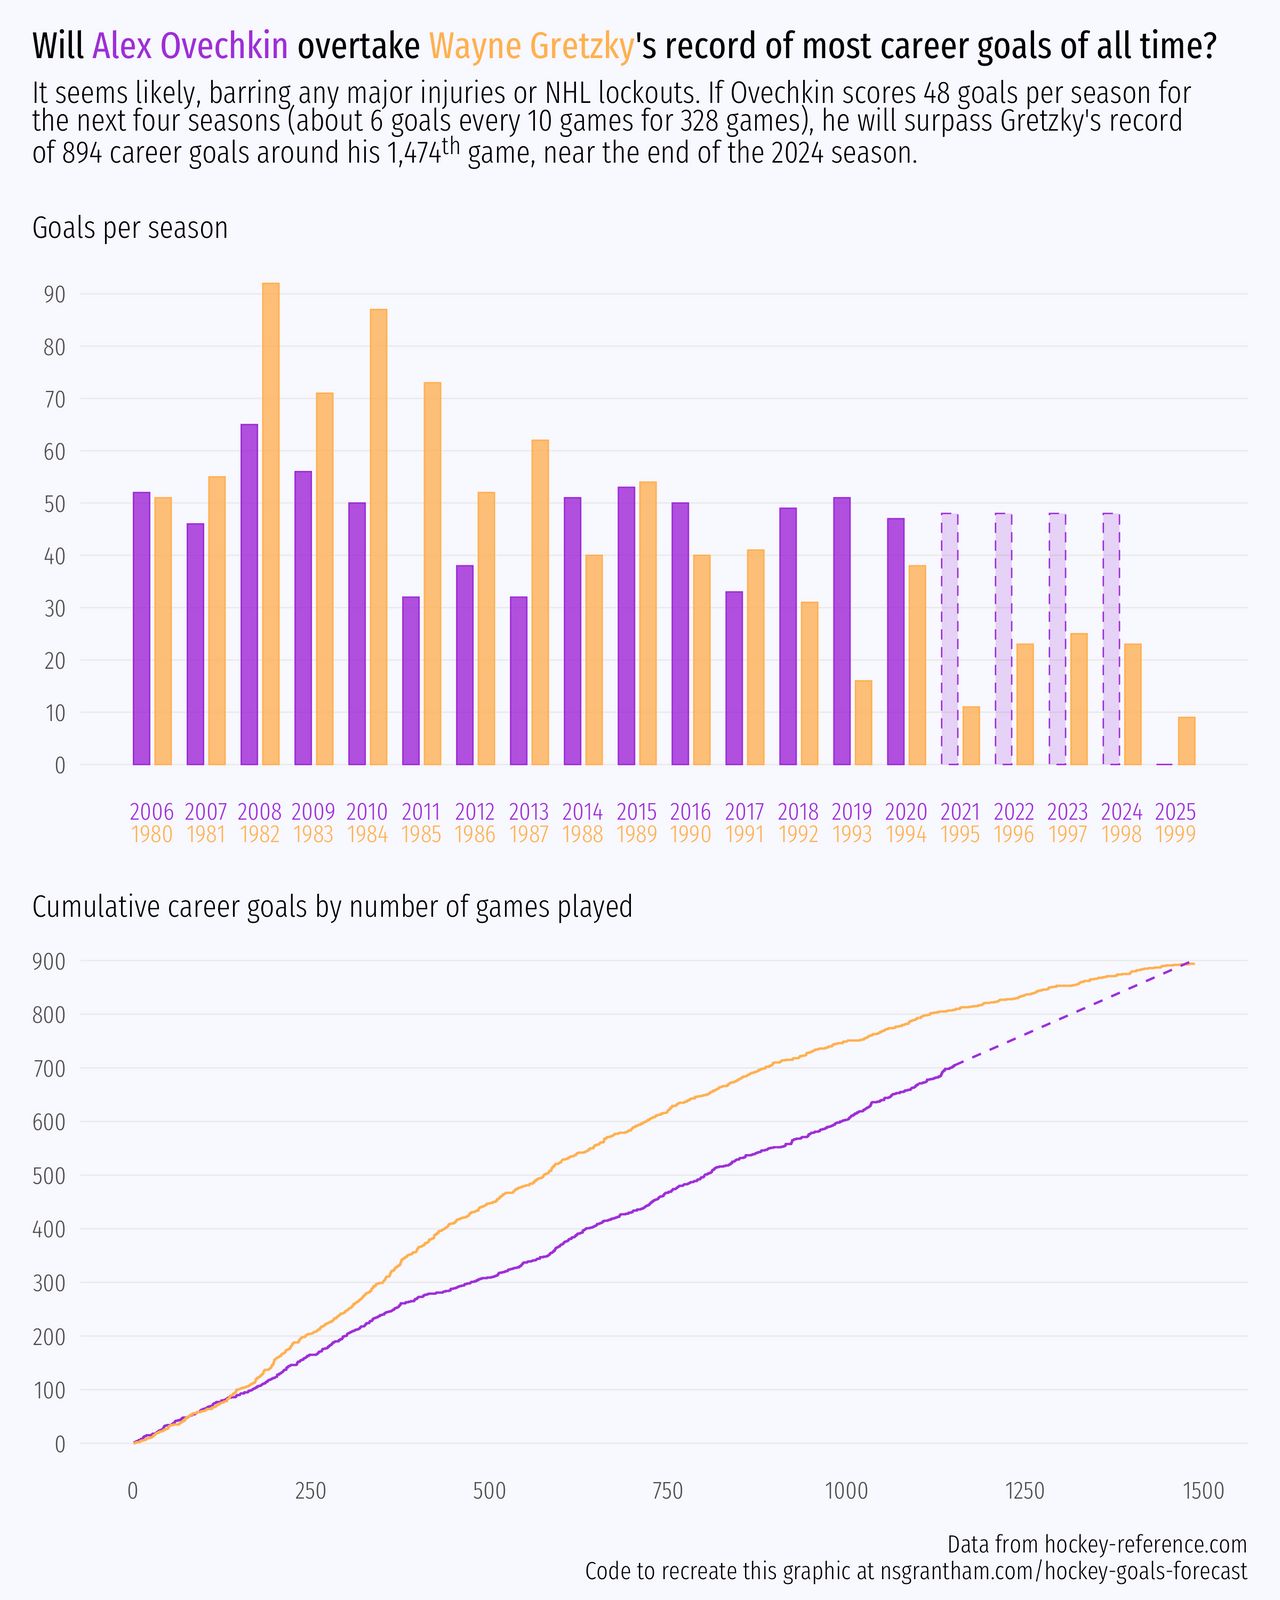
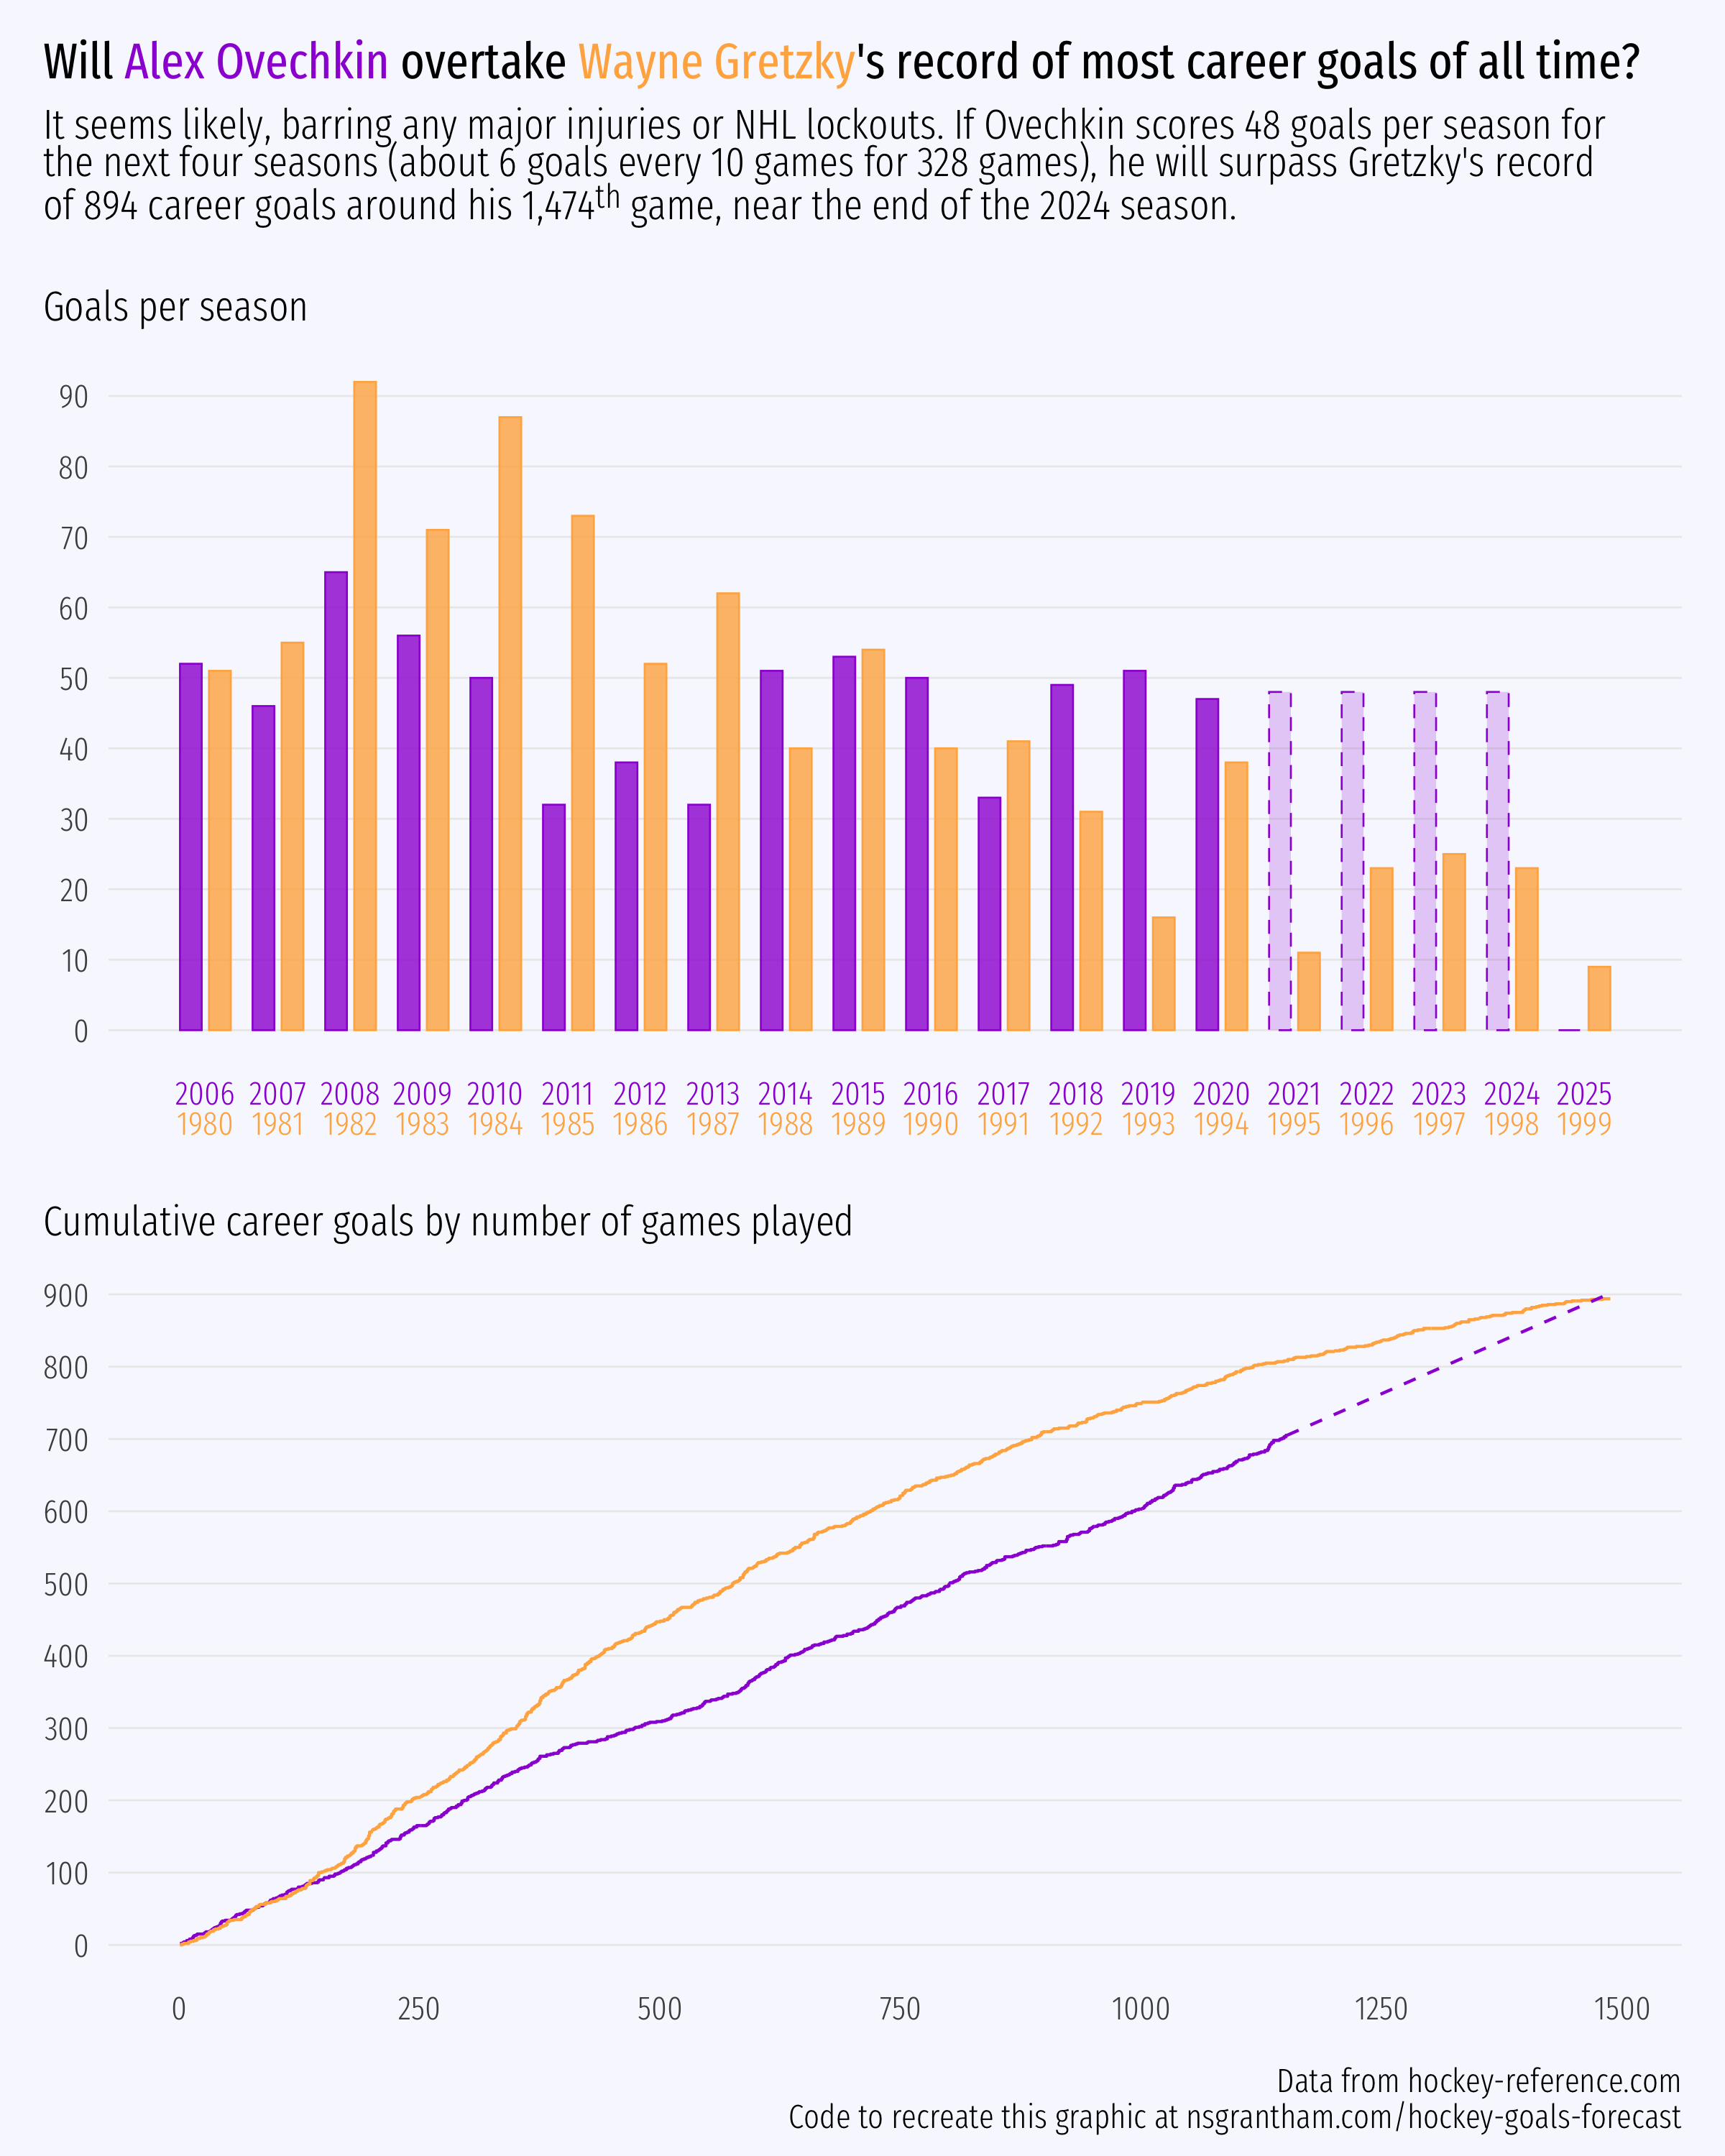
Wayne Gretzky holds the record for most career goals of all time, having scored 894 goals in 1,497 goals across 20 seasons (1980 to 1999). “The Great One” has safely held this record for more than two decades, and he may safely hold it for many more years to come.
But a serious challenger has emerged in Washington Capitals captain Alex Ovechkin. On February 25, 2020, Ovechkin scored his 700th goal, making him the eighth hockey player in history to join the 700 club. As he nears the end of his 15th season, Ovechkin appears to be closing in on Gretzky’s record.
Will Ovechkin overtake Gretzky? And if so, when?
To answer these questions, we will use data from hockey-reference.com collected by The Washington post for a recent article Alex Ovechkin: 700 goals and counting.
library(tidyverse)
library(patchwork)
library(ggtext)

game_goals <- read_csv("https://raw.githubusercontent.com/rfordatascience/tidytuesday/master/data/2020/2020-03-03/game_goals.csv")

game_goals
# A tibble: 49,384 x 25
   player season  rank date       game_num age   team  at    opp   location outcome
   <chr>   <dbl> <dbl> <date>        <dbl> <chr> <chr> <chr> <chr> <chr>    <chr>
 1 Alex …   2006     1 2005-10-05        1 20-0… WSH   NA    CBJ   Home     W
 2 Alex …   2006     2 2005-10-07        2 20-0… WSH   NA    ATL   Home     L
 3 Alex …   2006     3 2005-10-08        3 20-0… WSH   @     ATL   Away     L
 4 Alex …   2006     4 2005-10-10        4 20-0… WSH   NA    NYR   Home     W
 5 Alex …   2006     5 2005-10-12        5 20-0… WSH   @     CAR   Away     L
 6 Alex …   2006     6 2005-10-13        6 20-0… WSH   NA    NYI   Home     L
 7 Alex …   2006     7 2005-10-16        7 20-0… WSH   NA    TBL   Home     W
 8 Alex …   2006     8 2005-10-20        8 20-0… WSH   @     FLA   Away     L
 9 Alex …   2006     9 2005-10-22        9 20-0… WSH   NA    CAR   Home     L
10 Alex …   2006    10 2005-10-26       10 20-0… WSH   @     BUF   Away     W
# … with 49,374 more rows, and 14 more variables: goals <dbl>, assists <dbl>,
#   points <dbl>, plus_minus <dbl>, penalty_min <dbl>, goals_even <dbl>,
#   goals_powerplay <dbl>, goals_short <dbl>, goals_gamewinner <dbl>,
#   assists_even <dbl>, assists_powerplay <dbl>, assists_short <dbl>, shots <dbl>,
#   shot_percent <dbl>
Let’s filter this down to only goals made by Wayne Gretzky and Alex Ovechkin. We’ll define two new variables, which count the season number and number of career games played, and we’ll add in the results of 5 more games that have been played since the data were collected.
game_goals <- game_goals %>%
  filter(player %in% c("Alex Ovechkin", "Wayne Gretzky")) %>%
  select(player, season, date, goals) %>%
  bind_rows(
    tribble(
      ~player, ~season, ~date, ~goals,
      "Alex Ovechkin", 2020, lubridate::ymd("2020-02-27"), 0,
      "Alex Ovechkin", 2020, lubridate::ymd("2020-03-01"), 2,
      "Alex Ovechkin", 2020, lubridate::ymd("2020-03-04"), 0,
      "Alex Ovechkin", 2020, lubridate::ymd("2020-03-05"), 2,
      "Alex Ovechkin", 2020, lubridate::ymd("2020-03-07"), 0
    )
  ) %>%
  group_by(player) %>%
  mutate(game_num = as.numeric(factor(date)),
         season_num = as.numeric(factor(season))) %>%
  ungroup()

game_goals
# A tibble: 2,638 x 6
   player        season date       goals game_num season_num
   <chr>          <dbl> <date>     <dbl>    <dbl>      <dbl>
 1 Alex Ovechkin   2006 2005-10-05     2        1          1
 2 Alex Ovechkin   2006 2005-10-07     0        2          1
 3 Alex Ovechkin   2006 2005-10-08     0        3          1
 4 Alex Ovechkin   2006 2005-10-10     1        4          1
 5 Alex Ovechkin   2006 2005-10-12     1        5          1
 6 Alex Ovechkin   2006 2005-10-13     0        6          1
 7 Alex Ovechkin   2006 2005-10-16     0        7          1
 8 Alex Ovechkin   2006 2005-10-20     2        8          1
 9 Alex Ovechkin   2006 2005-10-22     0        9          1
10 Alex Ovechkin   2006 2005-10-26     0       10          1
# … with 2,628 more rows
We can count each player’s cumulative career goals by number of games played.
cumulative_career_goals <- game_goals %>%
  group_by(player) %>%
  mutate(goals = cumsum(goals)) %>%
  ungroup()

cumulative_career_goals
# A tibble: 2,638 x 6
   player        season date       goals game_num season_num
   <chr>          <dbl> <date>     <dbl>    <dbl>      <dbl>
 1 Alex Ovechkin   2006 2005-10-05     2        1          1
 2 Alex Ovechkin   2006 2005-10-07     2        2          1
 3 Alex Ovechkin   2006 2005-10-08     2        3          1
 4 Alex Ovechkin   2006 2005-10-10     3        4          1
 5 Alex Ovechkin   2006 2005-10-12     4        5          1
 6 Alex Ovechkin   2006 2005-10-13     4        6          1
 7 Alex Ovechkin   2006 2005-10-16     4        7          1
 8 Alex Ovechkin   2006 2005-10-20     6        8          1
 9 Alex Ovechkin   2006 2005-10-22     6        9          1
10 Alex Ovechkin   2006 2005-10-26     6       10          1
# … with 2,628 more rows
cumulative_career_goals %>%
  group_by(player) %>%
  summarize(max_goals = max(goals), max_game_num = max(game_num)) %>%
  ungroup()
# A tibble: 2 x 3
  player        max_goals max_game_num
  <chr>             <dbl>        <dbl>
1 Alex Ovechkin       705         1151
2 Wayne Gretzky       894         1487
If Ovechkin scores 48 goals per season over the next four seasons, he will beat Gretzky’s record. In addition to portraying cumulative career goals as a stepgraph, let’s also include a dashed line segment that represents this forecast.
ovechkin_goals_forecast <- tibble(
  player = "Alex Ovechkin",
  x1 = 1151,
  y1 = 705,
  x2 = 1479, # 1151 games + 4 seasons * 82 games per season
  y2 = 897   #  705 goals + 4 seasons * 48 goals per season
)

ao_color <- "#9D02D7"
wg_color <- "#FFB14E"

p_career <- ggplot(cumulative_career_goals, aes(x = game_num, y = goals, color = player)) +
  geom_step() +
  geom_segment(data = ovechkin_goals_forecast, aes(x = x1, y = y1, xend = x2, yend = y2), linetype = "dashed") +
  scale_x_continuous(breaks = seq(0, 1500, by = 250)) +
  scale_y_continuous(breaks = seq(0, 900, by = 100)) +
  scale_color_manual(values = c(ao_color, wg_color)) +
  guides(color = FALSE) +
  labs(subtitle = "Cumulative career goals by number of games played", x = NULL, y = NULL)

p_career
How many goals did each player make per season?
season_goals <- game_goals %>%
  group_by(player, season_num) %>%
  summarize(goals = sum(goals)) %>%
  ungroup() %>%
  mutate(forecast = FALSE) %>%
  bind_rows(
    tribble(
      ~player, ~season_num, ~goals, ~forecast,
      "Alex Ovechkin", 16, 48, TRUE,
      "Alex Ovechkin", 17, 48, TRUE,
      "Alex Ovechkin", 18, 48, TRUE,
      "Alex Ovechkin", 19, 48, TRUE,
      "Alex Ovechkin", 20,  0, TRUE
    )
  )

season_goals
# A tibble: 40 x 4
   player        season_num goals forecast
   <chr>              <dbl> <dbl> <lgl>
 1 Alex Ovechkin          1    52 FALSE
 2 Alex Ovechkin          2    46 FALSE
 3 Alex Ovechkin          3    65 FALSE
 4 Alex Ovechkin          4    56 FALSE
 5 Alex Ovechkin          5    50 FALSE
 6 Alex Ovechkin          6    32 FALSE
 7 Alex Ovechkin          7    38 FALSE
 8 Alex Ovechkin          8    32 FALSE
 9 Alex Ovechkin          9    51 FALSE
10 Alex Ovechkin         10    53 FALSE
# … with 30 more rows
We’ll show goals per season as a side-by-side bar chart.
ao_season_labels <- glue::glue("<span style='color:{ao_color}'>{2006:2025}</span>")
wg_season_labels <- glue::glue("<span style='color:{wg_color}'>{1980:1999}</span>")
season_labels <- glue::glue("{ao_season_labels}<br>{wg_season_labels}")

p_season <- ggplot(season_goals, aes(x = season_num, y = goals, color = player, fill = player, alpha = forecast, linetype = forecast)) +
  geom_col(position = position_dodge(width = 0.8), width = 0.6, size = 0.3) +
  scale_x_continuous(breaks = 1:20, labels = season_labels) +
  scale_y_continuous(breaks = seq(0, 90, by = 10)) +
  scale_color_manual(values = c(ao_color, wg_color)) +
  scale_fill_manual(values = c(ao_color, wg_color)) +
  scale_alpha_manual(values = c(0.8, 0.2)) +
  scale_linetype_manual(values = c("solid", "dashed")) +
  guides(color = FALSE, fill = FALSE, alpha = FALSE, linetype = FALSE) +
  labs(subtitle = "Goals per season", x = NULL, y = NULL)
Finally, we combine the two plots, add a title, subtitle, and caption, and tweak the theme to our liking.
p_season / p_career +
  plot_annotation(
    title = glue::glue("Will <span style='color:{ao_color}'>Alex Ovechkin</span> overtake <span style='color:{wg_color}'>Wayne Gretzky</span>'s record of most career goals of all time?"),
    subtitle = "It seems likely, barring any major injuries or NHL lockouts. If Ovechkin scores 48 goals per season for<br>the next four seasons (about 6 goals every 10 games for 328 games), he will surpass Gretzky's record<br>of 894 career goals around his 1,474<sup>th</sup> game, near the end of the 2024 season.",
    caption = "Data from hockey-reference.com\nCode to recreate this graphic at nsgrantham.com/hockey-goals-forecast"
  ) &
  theme_minimal(base_family = "Fira Sans Extra Condensed Light", base_size = 14) +
  theme(
    plot.title = element_markdown(family = "Fira Sans Extra Condensed"),
    plot.subtitle = element_markdown(),
    plot.title.position = "plot",
    plot.caption.position = "plot",
    plot.background = element_rect(color = "#F8F8FF", fill = "#F8F8FF"),
    plot.margin = margin(1, 0.5, 0.5, 0.5, unit = "line"),
    panel.grid.major.x = element_blank(),
    panel.grid.minor.x = element_blank(),
    panel.grid.major.y = element_line(size = 0.3),
    panel.grid.minor.y = element_blank(),
    axis.text.x = element_markdown()
  )

ggsave("hockey-goals-forecast.png", width = 8, height = 10)
It sure seems likely Alex Ovechkin will overtake Wayne Gretzky’s record within the next four, maybe five, seasons. But time will tell!