I love ggplot2. It is the main reason I use R for exploratory data analysis and data visualization.
These days there is also a rich ecosystem of extension packages for ggplot2, many of which are listed at exts.ggplot2.tidyverse.org. My package, ggdark, is listed there!
In this post we’ll use data scraped from CRAN to explore the state of the ggplot2 package ecosystem.
library(tidyverse)
library(ggdark)
cran <- read_csv("https://raw.githubusercontent.com/rfordatascience/tidytuesday/master/data/2019/2019-11-12/loc_cran_packages.csv")
gg_pkg_names <- c(
"ggplot2", "gganimate", "ggthemes", "esquisse", "ggraph",
"ggrepel", "ggstatsplot", "ggalt", "ggforce", "cowplot",
"ggfortify", "ggiraph", "GGally", "ggsci", "ggbeeswarm",
"ggridges", "ggExtra", "ggtech", "survminer", "ggdag",
"ggedit", "ggalluvial", "ggstance", "ggTimeSeries", "ggradar",
"ggfittext", "treemapify", "lemons", "gggenes", "gghalves",
"ggmosaic", "ggnetwork", "plotROC", "geomnet", "tvthemes",
"ggmuller", "ggseas", "sugrrants", "ggpol", "ggdark",
"lindia", "autoplotly", "ggQC", "ggplotr", "ggquiver",
"ggformula", "ggQQunif", "xmrr", "ggpmisc", "ggspectra"
)
ggplot2_and_exts <- cran %>%
filter(language == "R", pkg_name %in% gg_pkg_names) %>%
mutate(major_version = str_sub(version, 1, 1)) %>%
arrange(code) %>%
mutate(pkg_name = fct_inorder(pkg_name))
ggplot2_and_exts %>%
summarize(sum(code))
ggplot2_and_exts %>%
group_by(major_version) %>%
count()
ggplot(ggplot2_and_exts, aes(pkg_name, code, fill = major_version)) +
geom_col() +
coord_flip() +
scale_fill_manual(values = c( "#FFB14E", "#FA8775", "#EA5F94", "#CD34B5", "#9D02D7")) +
scale_y_continuous(labels = scales::comma, breaks = c(0, 1250, 2500, 5000, 10000, 20000)) +
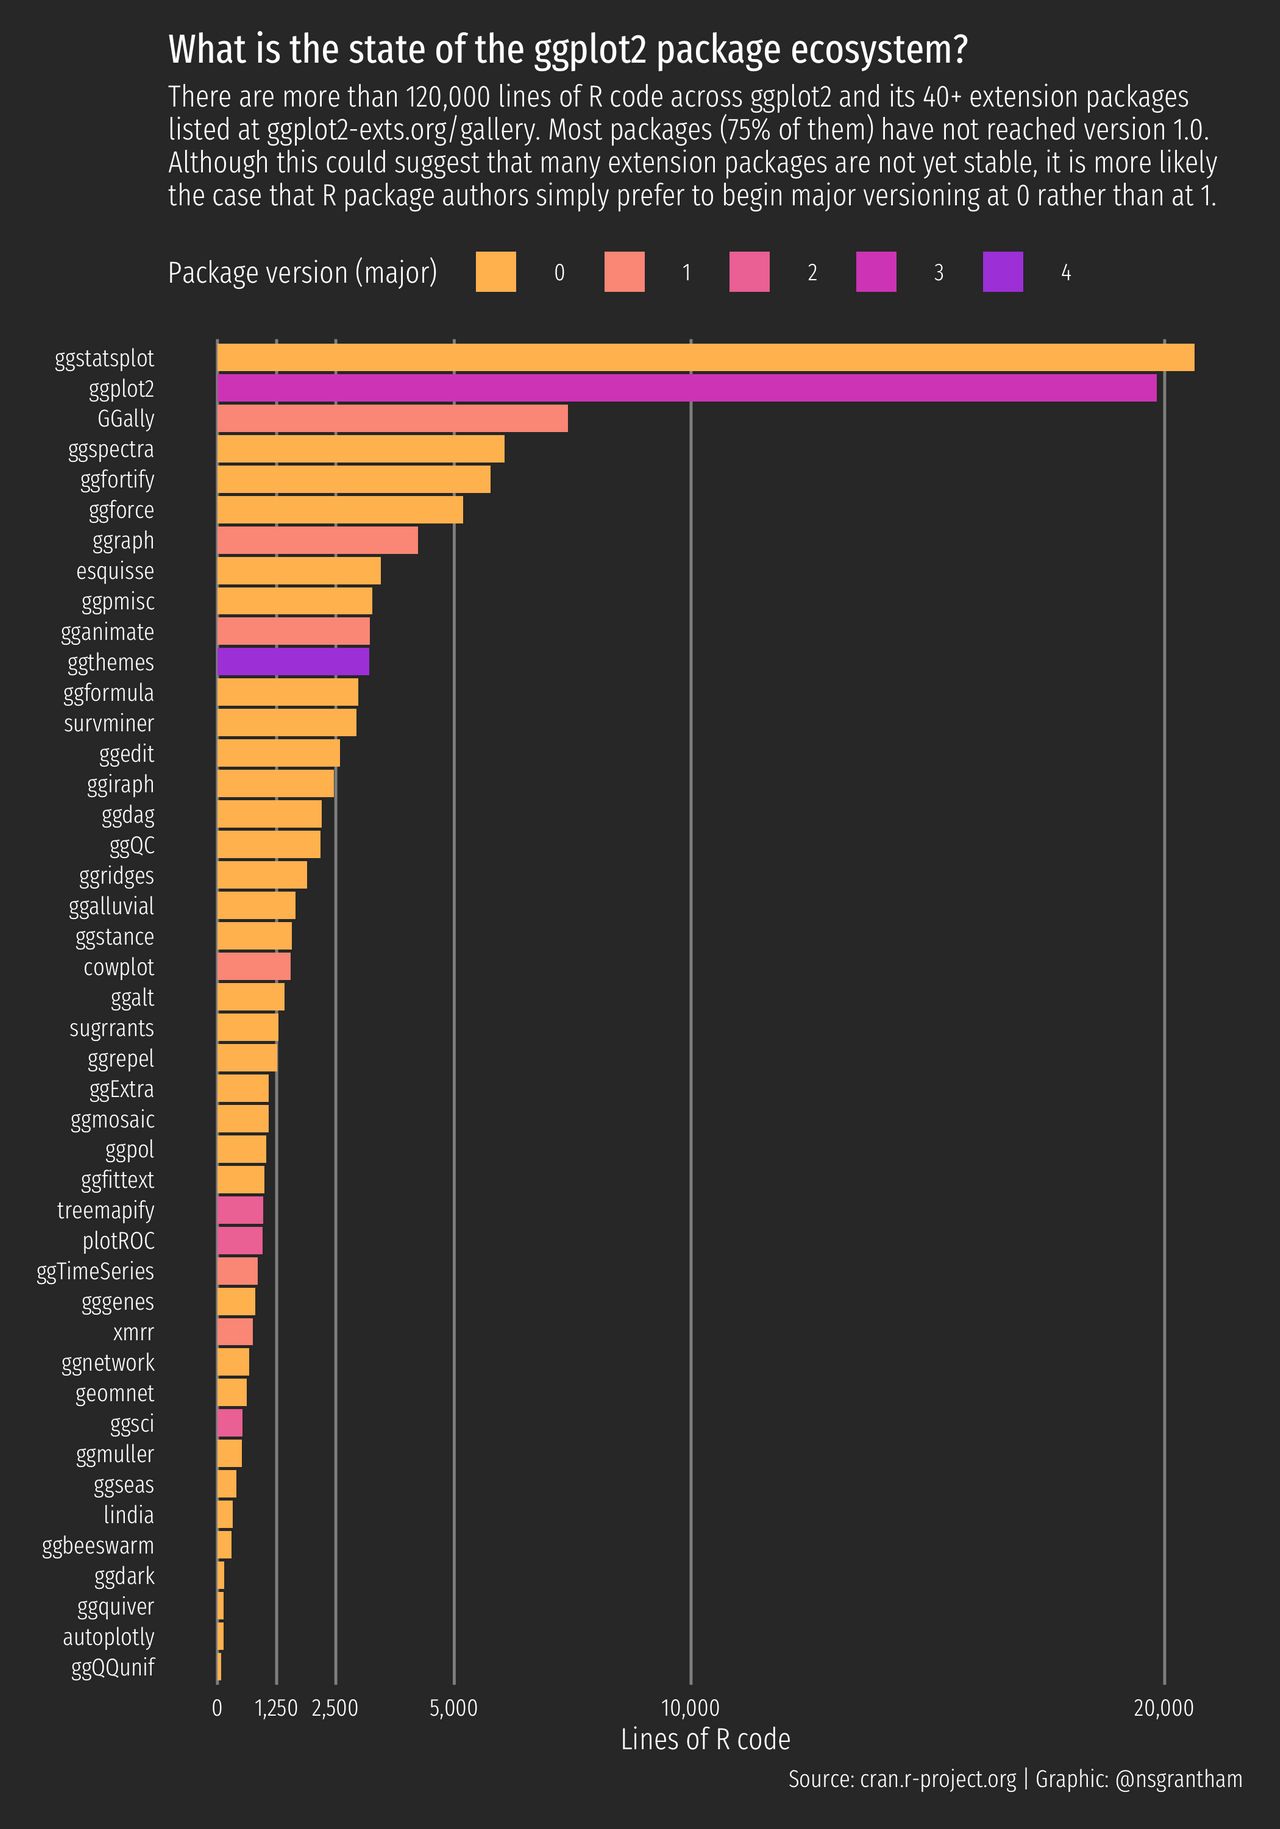
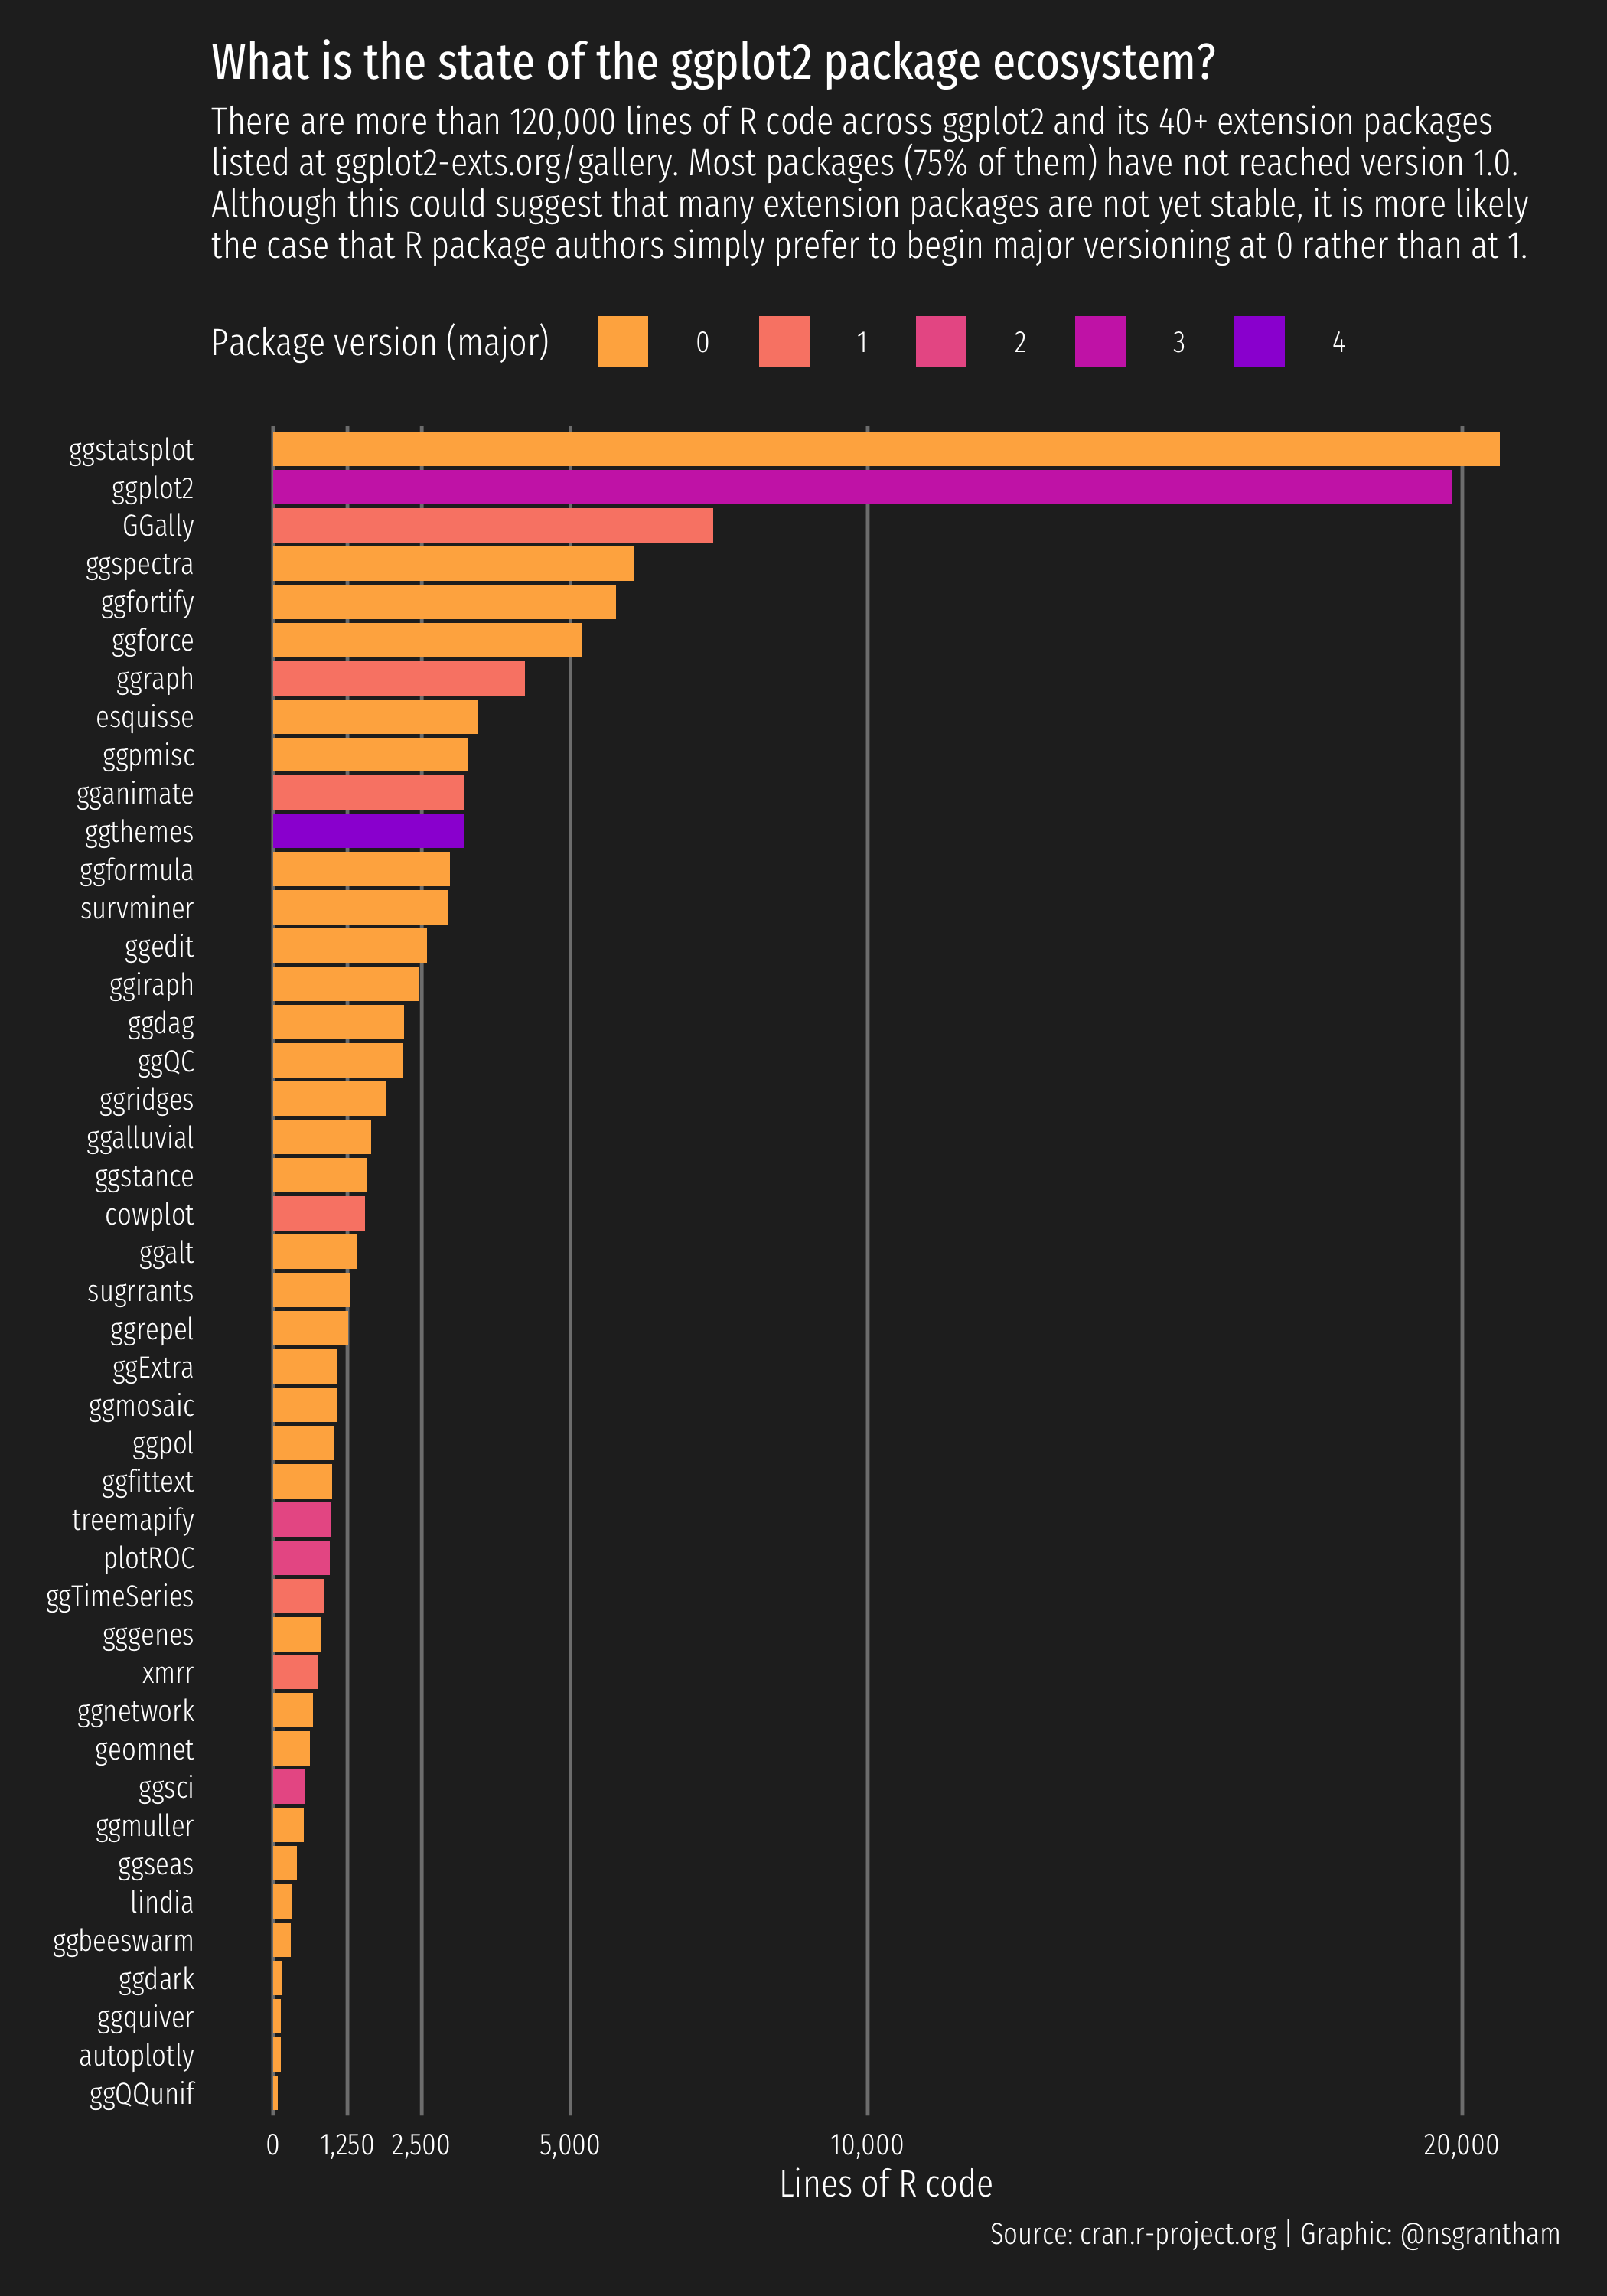
labs(title = 'What is the state of the ggplot2 package ecosystem?',
subtitle = "There are more than 120,000 lines of R code across ggplot2 and its 40+ extension packages\nlisted at ggplot2-exts.org/gallery. Most packages (75% of them) have not reached version 1.0.\nAlthough this could suggest that many extension packages are not yet stable, it is more likely\nthe case that R package authors simply prefer to begin major versioning at 0 rather than at 1.",
y = "Lines of R code", x = NULL, fill = "Package version (major)",
caption = "Source: cran.r-project.org | Graphic: @nsgrantham") +
dark_theme_minimal(base_family = "Fira Sans Extra Condensed Light", base_size = 12) +
theme(plot.title = element_text(family = "Fira Sans Extra Condensed", size = 16, vjust = 14),
plot.subtitle = element_text(vjust = 19),
plot.background = element_rect(color = "grey15", fill = "grey15"),
plot.margin = unit(c(4, 1, 1, 1), "lines"),
legend.position = c(0.42, 1.05),
legend.spacing.x = unit(1, "lines"),
legend.direction = "horizontal",
panel.spacing = unit(c(6, 1, 1, 1), "lines"),
panel.grid = element_line(color = "grey50"),
panel.grid.major.y = element_blank(),
panel.grid.minor.x = element_blank(),
axis.text = element_text(color = "white"))
ggsave("ggplot2-packages.png", height = 10, width = 7)