We are in a climate crisis.
China emits the most CO2 of any country, followed by the USA which emits about half as much. Transportation and energy production are the largest sources of CO2 emissions. Another source is food production, which accounts for one-quarter of total emissions.
Using emissions data from the Food and Agriculture Organization of the United Nations (FAO), let’s compare the carbon footprints of food production in the USA and China.
library(tidyverse)
library(fishualize)
library(waffle)  # devtools::install_github("hrbrmstr/waffle")

carbon_footprints <- read_csv("https://raw.githubusercontent.com/rfordatascience/tidytuesday/master/data/2020/2020-02-18/food_consumption.csv") %>%
  select(country, food = food_category, co2 = co2_emmission)

carbon_footprints
# A tibble: 1,430 x 3
   country   food                         co2
   <chr>     <chr>                      <dbl>
 1 Argentina Pork                       37.2
 2 Argentina Poultry                    41.5
 3 Argentina Beef                     1712
 4 Argentina Lamb & Goat                54.6
 5 Argentina Fish                        6.96
 6 Argentina Eggs                       10.5
 7 Argentina Milk - inc. cheese        278.
 8 Argentina Wheat and Wheat Products   19.7
 9 Argentina Rice                       11.2
10 Argentina Soybeans                    0
# … with 1,420 more rows
There are a lot of countries here. Let’s restrict our study to China and the USA. We’ll also rename some categories and rearrange the rows for the upcoming geom_waffle function.
carbon_footprints <- carbon_footprints  %>%
  filter(country %in% c("China", "USA")) %>%
  mutate(country = recode(country, "USA" = "Carbon footprint of the American diet", "China" = "Carbon footprint of the Chinese diet"),
         country = fct_relevel(country, c("Carbon footprint of the American diet", "Carbon footprint of the Chinese diet")),
         food = recode(food, "Nuts inc. Peanut Butter" = "Nuts", "Wheat and Wheat Products" = "Wheat", "Milk - inc. cheese" = "Dairy"),
         food = fct_relevel(food, c("Beef", "Dairy", "Pork", "Poultry", "Fish", "Wheat", "Lamb & Goat", "Nuts", "Eggs", "Rice", "Soybeans"))) %>%
  arrange(country, food)

carbon_footprints
# A tibble: 22 x 3
   country                               food           co2
   <fct>                                 <fct>        <dbl>
 1 Carbon footprint of the American diet Beef        1118.
 2 Carbon footprint of the American diet Dairy        363.
 3 Carbon footprint of the American diet Pork          97.8
 4 Carbon footprint of the American diet Poultry       53.7
 5 Carbon footprint of the American diet Fish          19.7
 6 Carbon footprint of the American diet Wheat         15.3
 7 Carbon footprint of the American diet Lamb & Goat   15.1
 8 Carbon footprint of the American diet Nuts          13.9
 9 Carbon footprint of the American diet Eggs          13.4
10 Carbon footprint of the American diet Rice           8.8
# … with 12 more rows
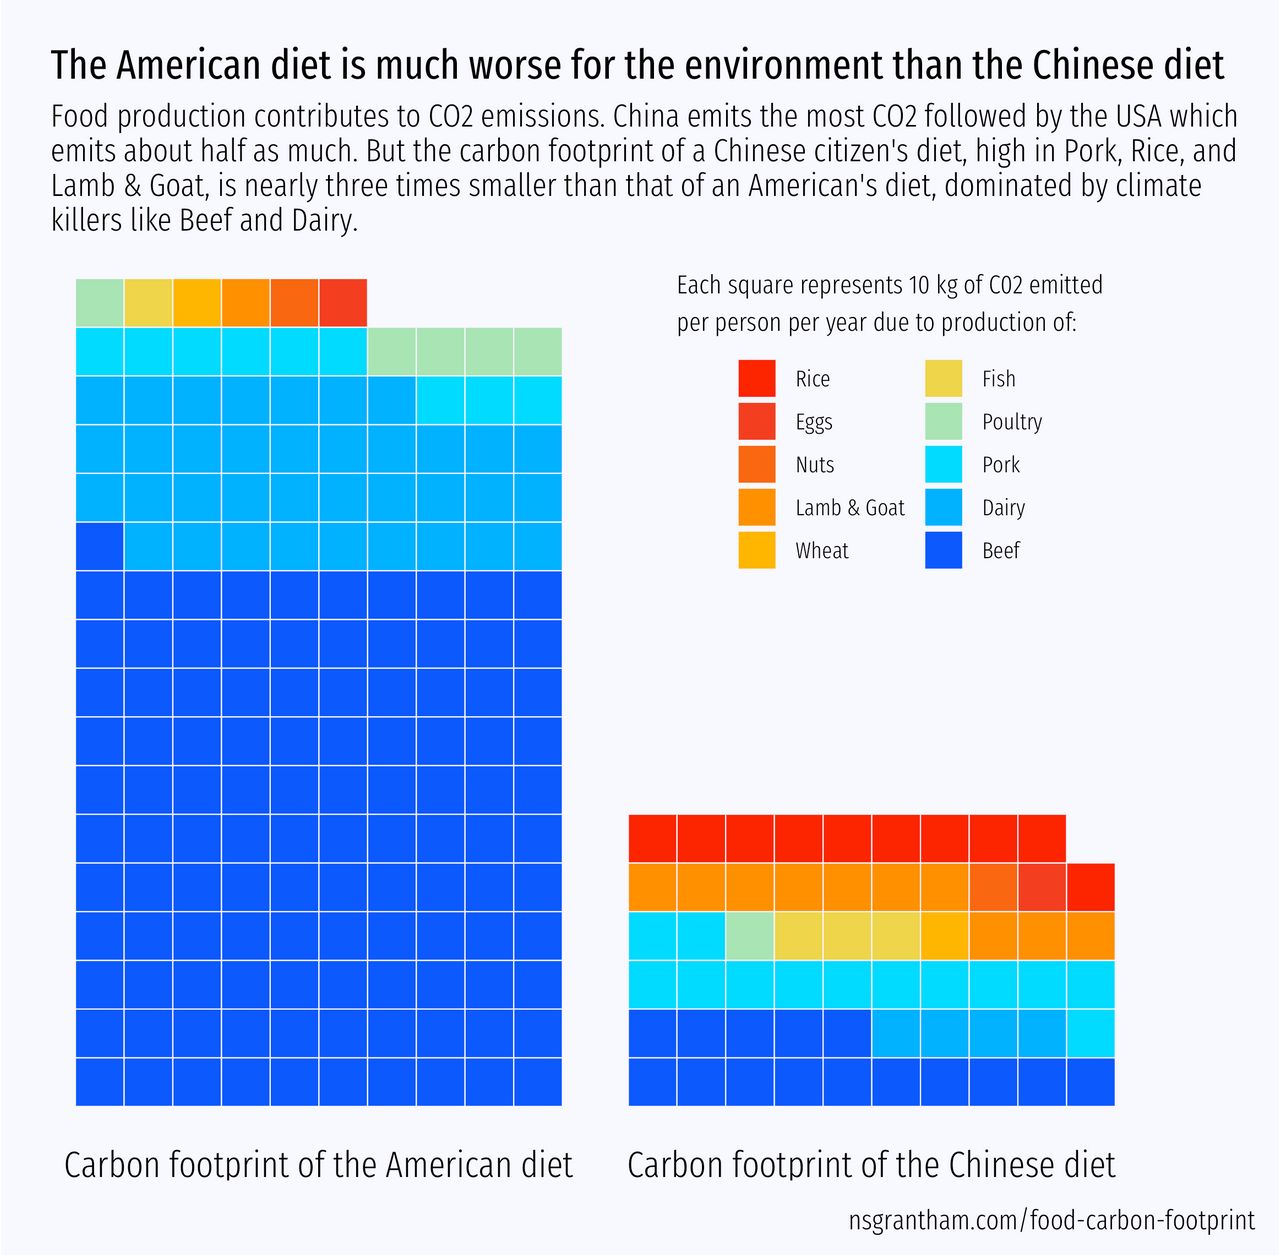
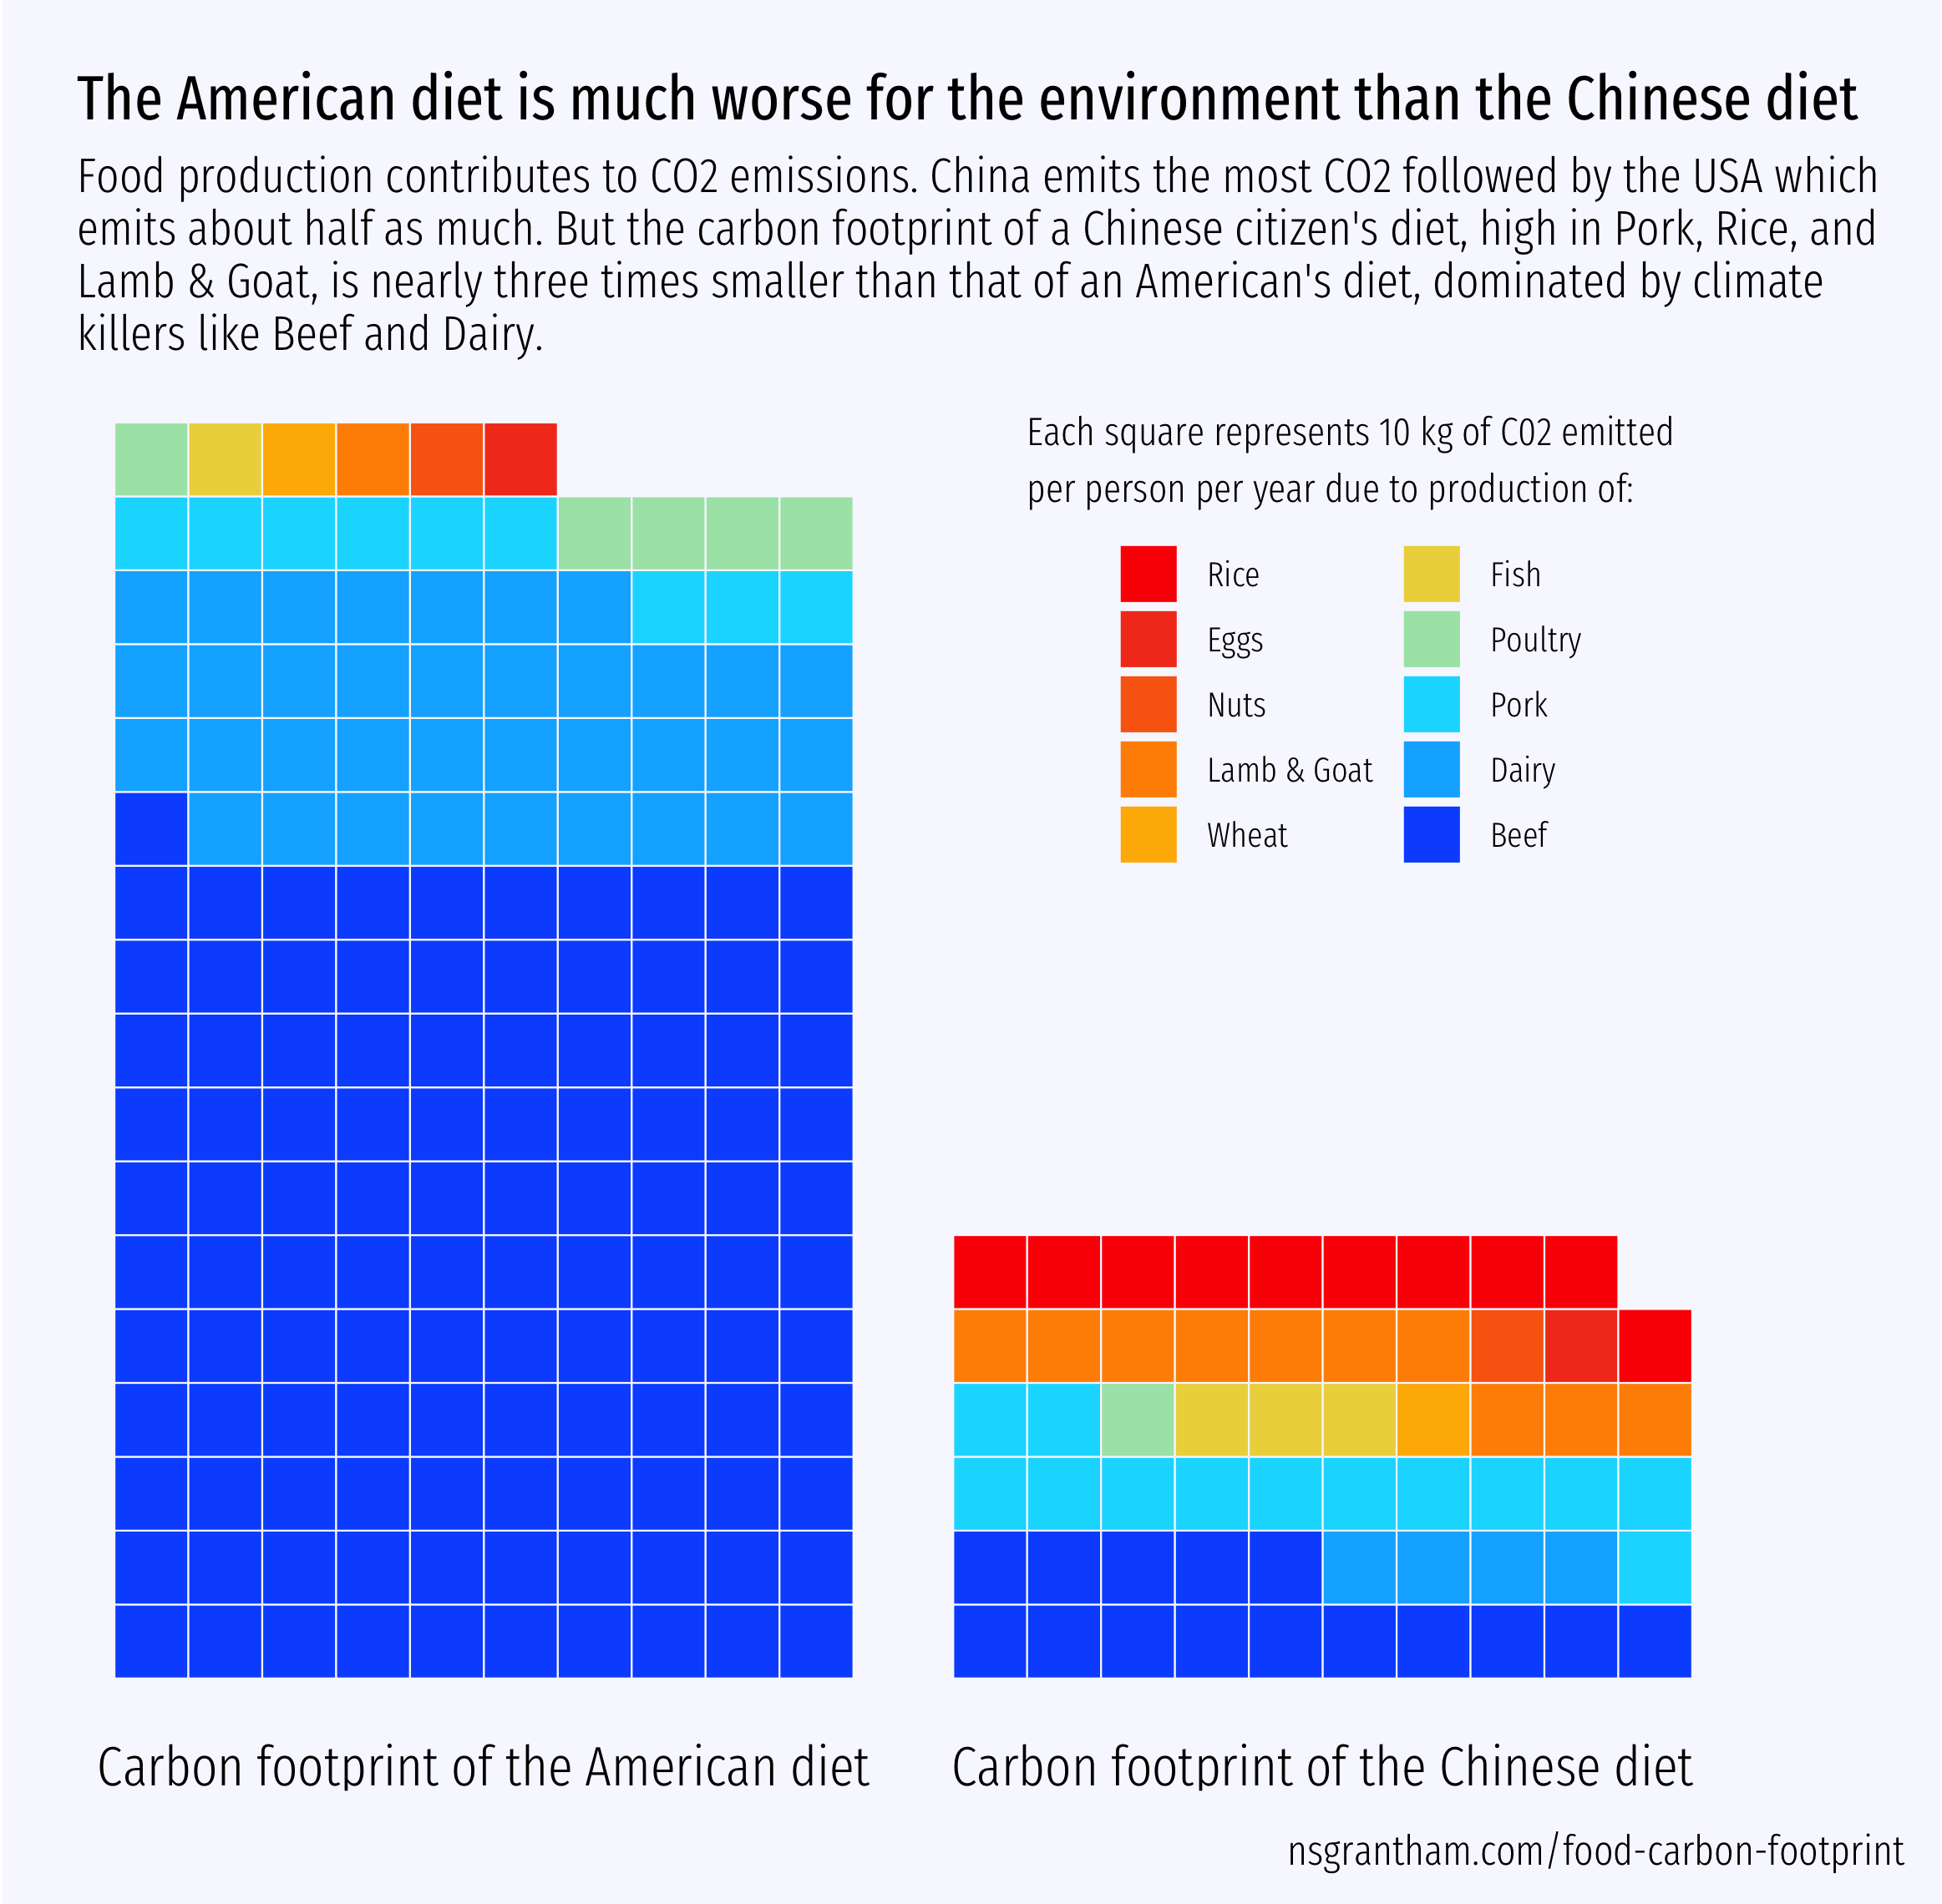
A waffle visualization is a good option here because it will help us clearly convey differences in the units of CO2 emitted (10 kg per person per year) between American and Chinese diets.
ggplot() +
  geom_waffle(data = carbon_footprints, aes(values = co2 / 10, fill = food),
              color = "#F8F8FF", size = .25, n_rows = 10, flip = TRUE) +
  facet_wrap(~ country, nrow = 1, strip.position = "bottom") +
  geom_text(data = data.frame(country = "Carbon footprint of the Chinese diet"), aes(x = 1.5, y = 17, label = "Each square represents 10 kg of C02 emitted\nper person per year due to production of:"),
            size = 4, hjust = 0, color = "black", family = "Fira Sans Extra Condensed Light") +
  coord_equal() +
  scale_fill_fish_d(option = "Hypsypops_rubicundus") +
  guides(fill = guide_legend(reverse = TRUE, ncol = 2)) +
  labs(
    title = "The American diet is much worse for the environment than the Chinese diet",
    subtitle = "Food production contributes to CO2 emissions. China emits the most CO2 followed by the USA which\nemits about half as much. But the carbon footprint of a Chinese citizen's diet, high in Pork, Rice, and\nLamb & Goat, is nearly three times smaller than that of an American's diet, dominated by climate\nkillers like Beef and Dairy.",
    caption = "nsgrantham.com/food-carbon-footprint",
    fill = NULL, x = NULL, y = NULL
  ) +
  theme_void(base_family = "Fira Sans Extra Condensed Light", base_size = 15) +
  theme(
    plot.background = element_rect(fill = "#F8F8FF", color = "#F8F8FF"),
    plot.title = element_text(family = "Fira Sans Extra Condensed"),
    plot.subtitle = element_text(size = 14),
    plot.caption = element_text(hjust = 1.17, vjust = -1.2),
    plot.margin = margin(1, 4.2, 1, 1.5, "lines"),
    strip.text = element_text(size = 16),
    legend.position = c(0.77, 0.76),
    legend.key.size = unit(1.3, "line"),
    legend.text = element_text(size = 10)
  )

ggsave("food-carbon-footprint.png", width = 7.75, height = 7.6)
Beef consumption in the American diet alone has a larger carbon footprint than that of the entire Chinese diet. In fact it’s almost twice the size.